Fig. 5
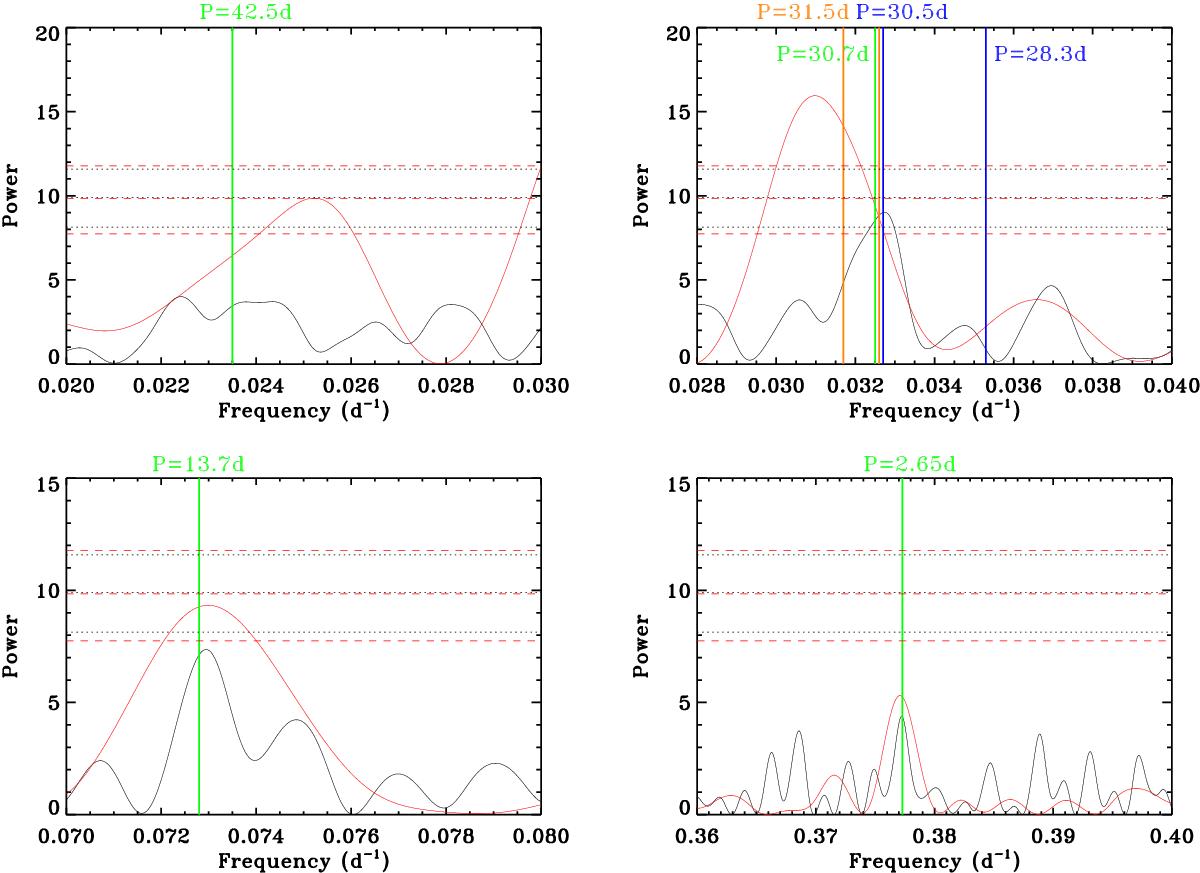
GLS periodograms around the frequency ranges of interest for two subsets of the original RV data. The first season has 61 data points and its periodogram is black (FAP: 0.1%, 1%, 10% horizontal black dotted lines), the second season has 75 data points and is plotted in red (FAP: 0.1%, 1%, 10% horizontal red dashed lines). The two upper panels refer to the frequencies related to activity (upper left: f = 0.0235 d-1 – P = 42.5 d; upper right: f = 0.0326 d-1 – P = 30.7 d). The two lower panels refer to the frequencies related to the candidate planets (lower left: f = 0.0729 d-1 – P = 13.7 d; lower right: f = 0.3773 d-1 – P = 2.65 d). The relevant frequencies derived from all the methods used on the full dataset are indicated with vertical lines green from RV analysis, blue from activity indexes, and orange from photometry (see Sect. 5).
Current usage metrics show cumulative count of Article Views (full-text article views including HTML views, PDF and ePub downloads, according to the available data) and Abstracts Views on Vision4Press platform.
Data correspond to usage on the plateform after 2015. The current usage metrics is available 48-96 hours after online publication and is updated daily on week days.
Initial download of the metrics may take a while.