Fig. 4
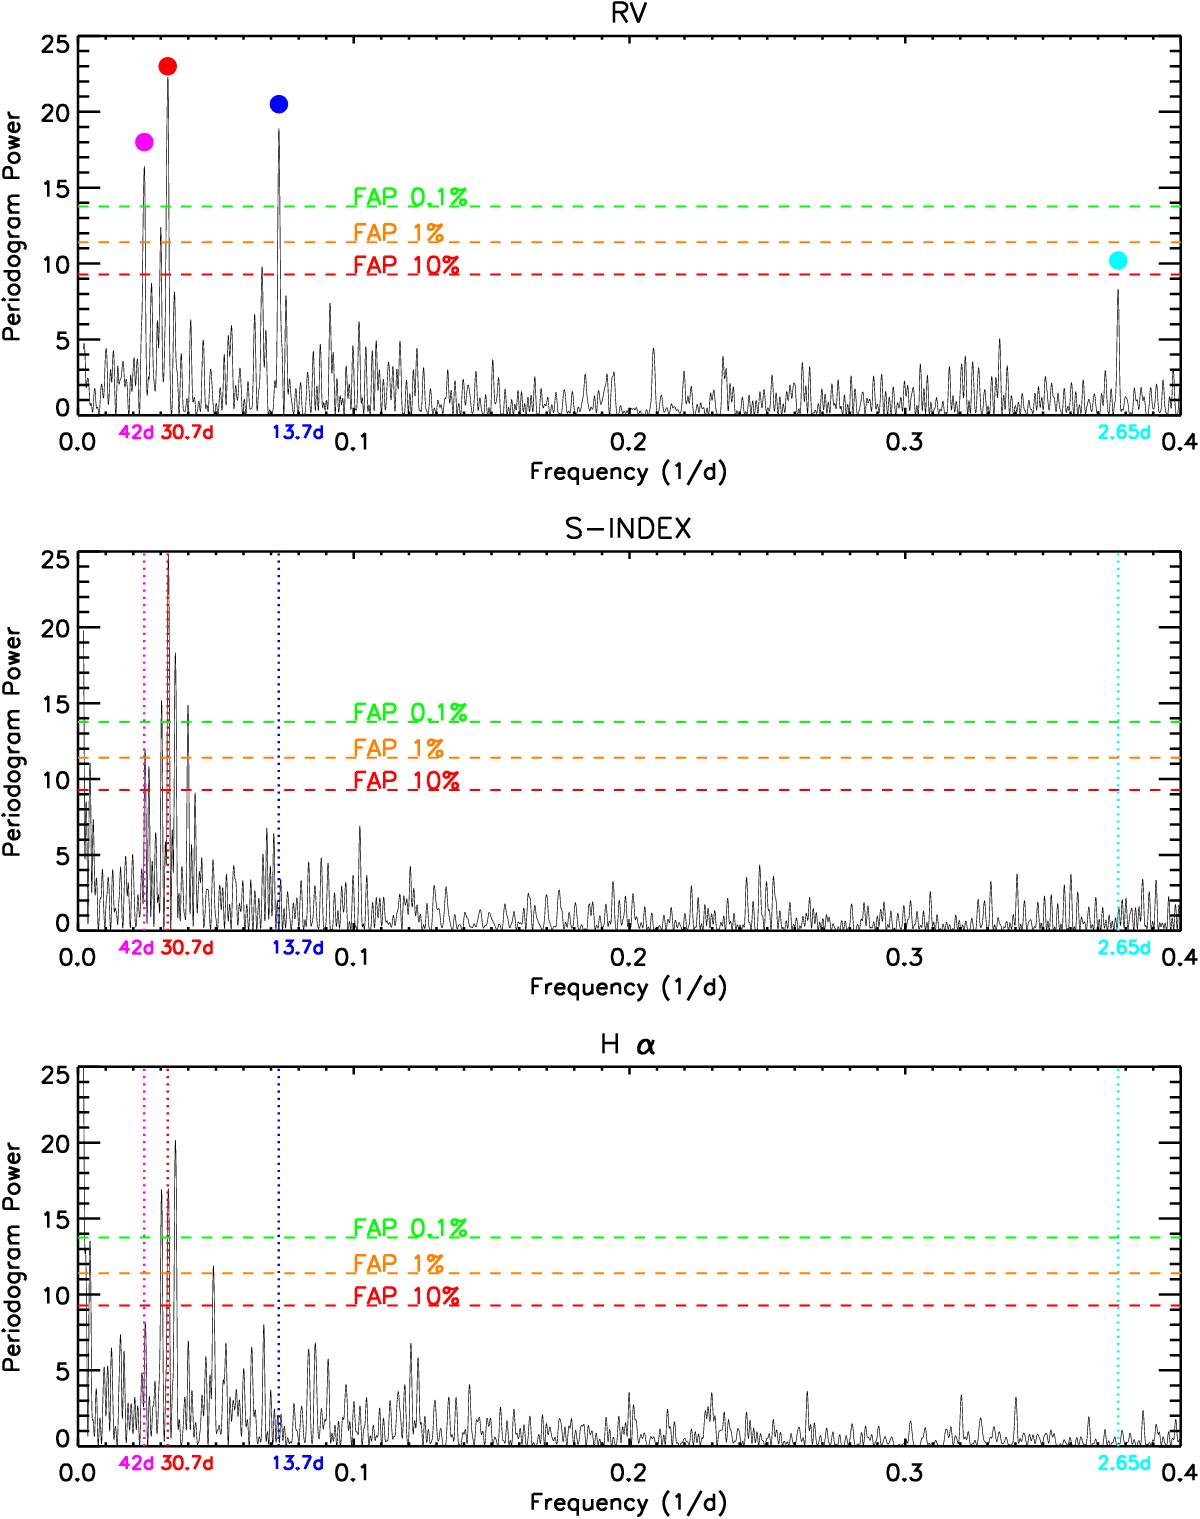
From top to bottom: GLS periodograms of RVs, S index, and Hα, zoomed around the frequencies of interest. The dotted blue and cyan lines indicate the frequencies corresponding to orbital periods of the candidate planets at 13.7 d and 2.65 d, respectively, while the dotted red and magenta lines show the frequencies corresponding to the activity periods at 30.7 d and 42.5 d, respectively. These frequencies and periods are marked with dots in the same color code in the upper RV panel.
Current usage metrics show cumulative count of Article Views (full-text article views including HTML views, PDF and ePub downloads, according to the available data) and Abstracts Views on Vision4Press platform.
Data correspond to usage on the plateform after 2015. The current usage metrics is available 48-96 hours after online publication and is updated daily on week days.
Initial download of the metrics may take a while.