Fig. 8
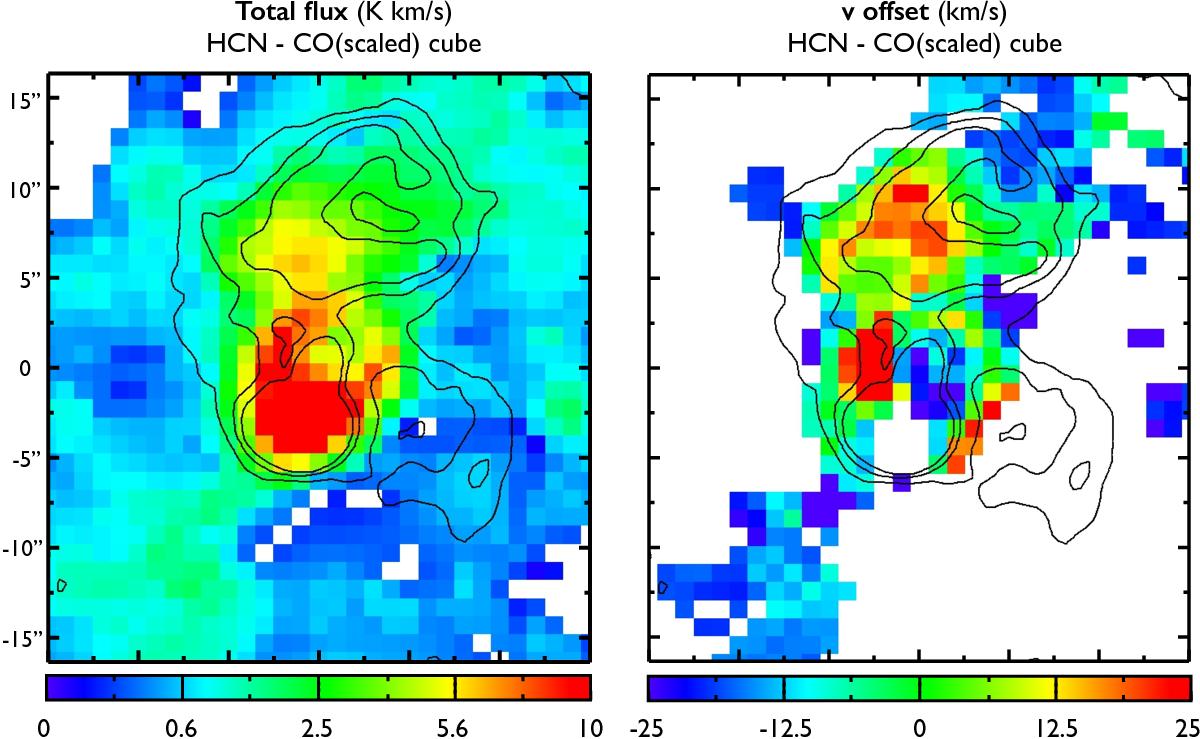
Maps showing the relative differences between HCN and CO profiles (when they are scaled to match the same peak brightness temperature). Left: total intensity in the HCN-CO scaled cube (moment-0). Right: intensity-weighted velocity offset in the HCN-CO scaled cube (moment-1), expressed relative to the CO velocity centroid in each position. The contours show the radio jet from Fig. 3, for reference. Both maps show the same field of view, 30′′ × 33′′, with large tickmarks indicating a separation of 5′′.
Current usage metrics show cumulative count of Article Views (full-text article views including HTML views, PDF and ePub downloads, according to the available data) and Abstracts Views on Vision4Press platform.
Data correspond to usage on the plateform after 2015. The current usage metrics is available 48-96 hours after online publication and is updated daily on week days.
Initial download of the metrics may take a while.