Fig. 7
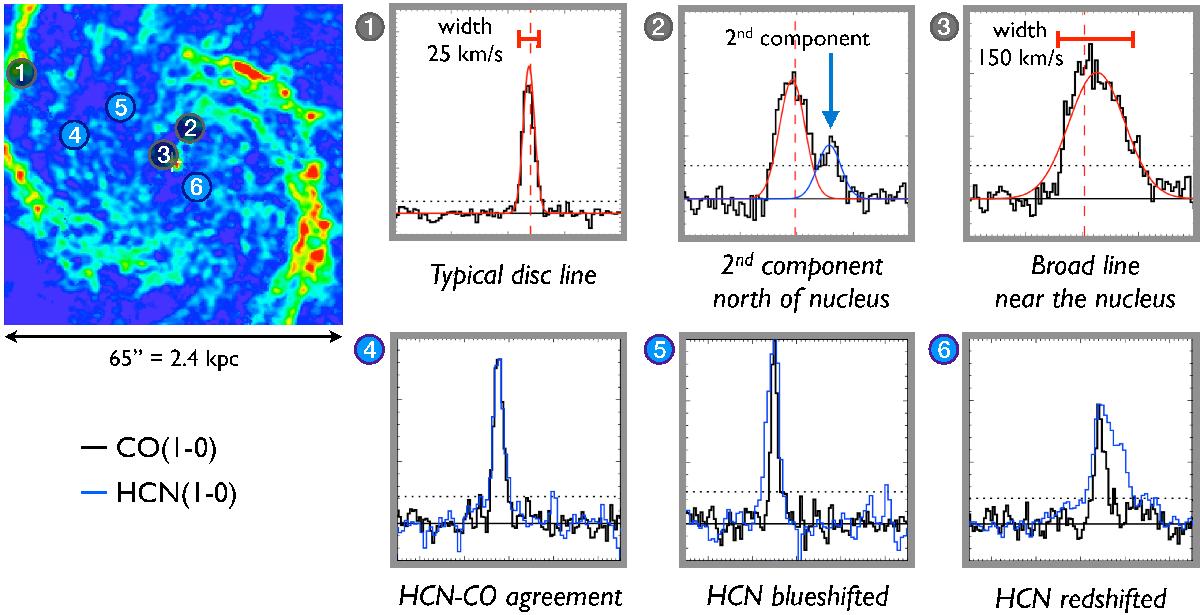
PAWS moment-0 map at 1′′ resolution with an indication of the positions where different spectra have been taken. The top row highlights some peculiar components in CO: contrary to the typical CO line of 20−30 km s-1 (1◯), important secondary components appear as we approach the nucleus (2◯) and a very broad line (≳ 100 km s-1,3 ◯) in the immediate surroundings of the AGN. The agreement of the main line with the expectation from a TiRiFiC model is remarkable (vertical red dashed line, implementing a Spekkens & Sellwood bar); the distinction between disc and outflow contribution is robust. The bottom row shows some differences between the CO and HCN profiles for three positions: while the agreement is excellent far from the radio jet (4◯), there are significant departures as we approach the outer envelope of the jet (5◯), and the differences can become extreme as we approach the nucleus (6◯). We note that in these line profiles the velocity axes span the range (−250, 250) km s-1, with major tickmarks separated by 100 km s-1 and minor tickmarks every 10 km s-1; the fluxes are in arbitrary units.
Current usage metrics show cumulative count of Article Views (full-text article views including HTML views, PDF and ePub downloads, according to the available data) and Abstracts Views on Vision4Press platform.
Data correspond to usage on the plateform after 2015. The current usage metrics is available 48-96 hours after online publication and is updated daily on week days.
Initial download of the metrics may take a while.