Fig. 6
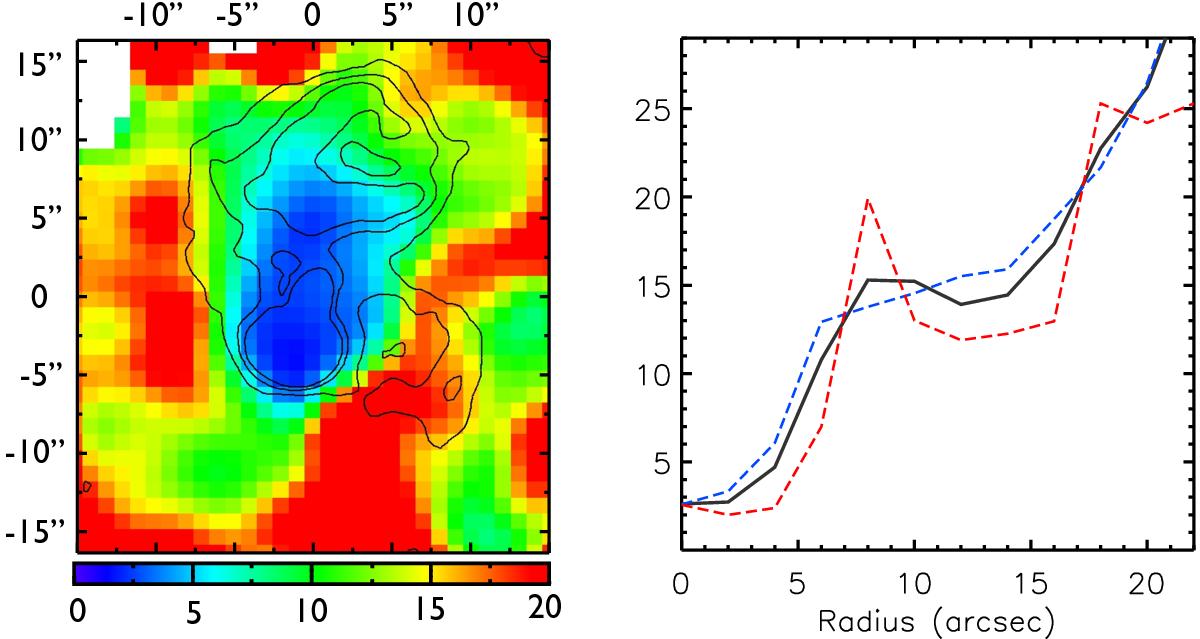
Map and radial profiles of the ratio of CO/HCN fluxes. The profile shows the median values of the CO/HCN in radial bins (black line), while the blue dashed line is the ratio of fluxes in the first Gaussian (disc), and the red dashed line is the ratio of fluxes in the second Gaussian (peculiar component); see Sect. 3.2.2.
Current usage metrics show cumulative count of Article Views (full-text article views including HTML views, PDF and ePub downloads, according to the available data) and Abstracts Views on Vision4Press platform.
Data correspond to usage on the plateform after 2015. The current usage metrics is available 48-96 hours after online publication and is updated daily on week days.
Initial download of the metrics may take a while.