Fig. 4
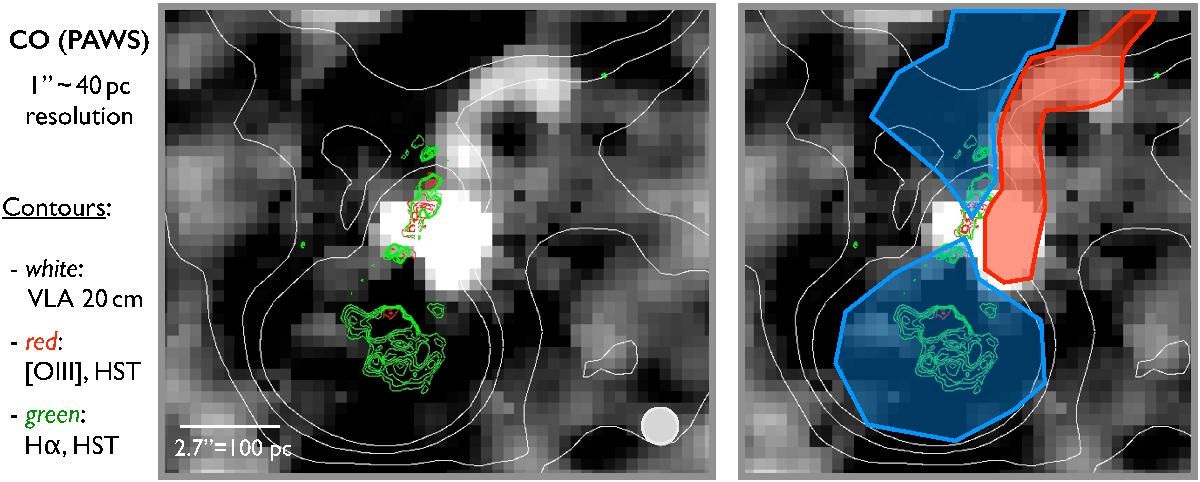
Zoom on the central 500 pc of the PAWS CO(1−0) intensity map (moment-0) at 1′′ resolution, with VLA 20 cm contours (Dumas et al. 2011), as well as [OIII] and [NII] + Hα from HST, indicating the ionisation region (Bradley et al. 2004); the panel on the right highlights how the ionisation region is associated with under-luminous CO emission (blue shaded area), while CO seems to accumulate towards the edge of the jet (red shaded area), supporting and expanding recent findings by Morganti et al. (2015).
Current usage metrics show cumulative count of Article Views (full-text article views including HTML views, PDF and ePub downloads, according to the available data) and Abstracts Views on Vision4Press platform.
Data correspond to usage on the plateform after 2015. The current usage metrics is available 48-96 hours after online publication and is updated daily on week days.
Initial download of the metrics may take a while.