Fig. 3
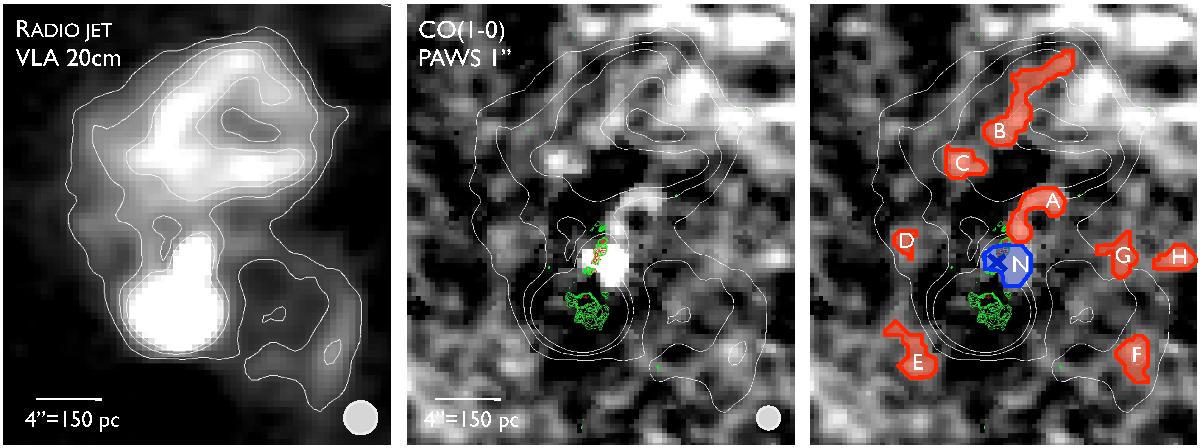
From left to right: VLA 20 cm continuum image showing the kpc-scale radio jet in M 51; molecular emission in the same region, traced by the CO(1−0) line imaged by PAWS at 1′′ resolution, with green and red contours delineating the NLR (Hα and [OIII] respectively, see Fig. 1); same image of molecular emission with some regions identified (quantitatively defined as contiguous regions with CO fluxes above 60 K km s-1). The XNC is the sourthern lobe that becomes apparent in the VLA 20 cm map, which coincides with strong Hα emission (green contours). The radio image is shown in linear scale from 5 × 10⁻⁵ to 5 × 10⁻⁴ Jy/beam, with three contours at levels 1.5, 3.0, and 4.5 × 10⁻⁴ Jy/beam (also reproduced on the maps of molecular emission). The CO(1−0) image is shown in linear scale between 10 and 120 K km s-1.
Current usage metrics show cumulative count of Article Views (full-text article views including HTML views, PDF and ePub downloads, according to the available data) and Abstracts Views on Vision4Press platform.
Data correspond to usage on the plateform after 2015. The current usage metrics is available 48-96 hours after online publication and is updated daily on week days.
Initial download of the metrics may take a while.