Fig. B.2
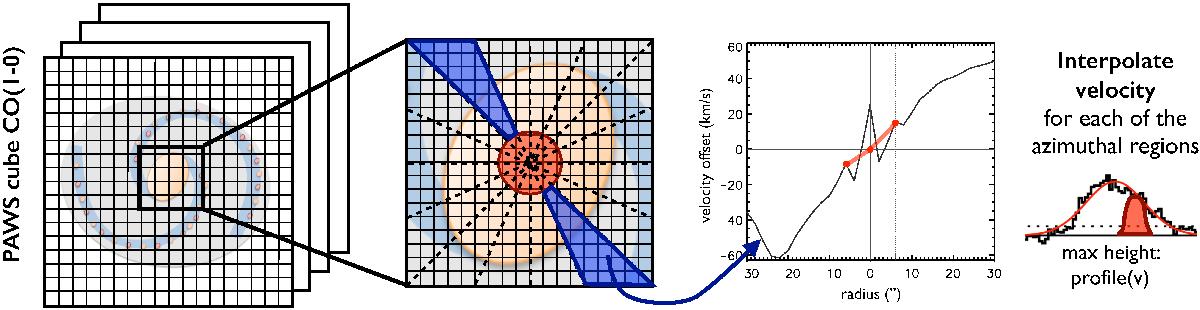
Sketch motivating our interpolation of the velocity centroid in the nuclear area affected by the outflow. In the central r ≲ 5′′ it becomes extremely hard to separate a line associated with the disc from the extremely broad outflowing component that dominates its flux. This is a visual illustration of how we estimate the maximum emission from disc, assuming that its main emission line has the same width as in the rest of the disc, ~25 km s-1, and that its velocity centroid can be linearly interpolated in this small region from the surroundings. We perform this interpolation along 16 different azimuthal regions, forcing the central position to coincide with the systemic velocity, 472 km s-1.
Current usage metrics show cumulative count of Article Views (full-text article views including HTML views, PDF and ePub downloads, according to the available data) and Abstracts Views on Vision4Press platform.
Data correspond to usage on the plateform after 2015. The current usage metrics is available 48-96 hours after online publication and is updated daily on week days.
Initial download of the metrics may take a while.