Fig. A.1
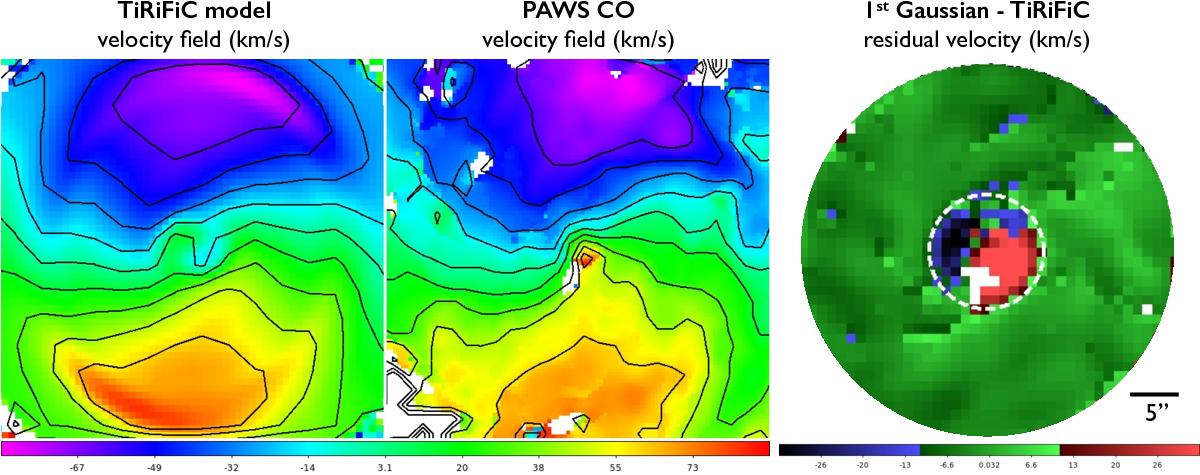
Velocity field of our TiRiFiC model compared to the velocity field from PAWS (moment-1, at 3′′ resolution). The isovelocity contours correspond to the range [−60 km s-1, 60 km s-1] in increments of Δv = 15 km s-1. The right panel shows the velocity difference between the first Gaussian fit (Sect. 3.2.2) and the velocity centroid from our TiRiFiC model, highlighting their good agreement except in the central r ≲ 5′′.
Current usage metrics show cumulative count of Article Views (full-text article views including HTML views, PDF and ePub downloads, according to the available data) and Abstracts Views on Vision4Press platform.
Data correspond to usage on the plateform after 2015. The current usage metrics is available 48-96 hours after online publication and is updated daily on week days.
Initial download of the metrics may take a while.