Fig. 13
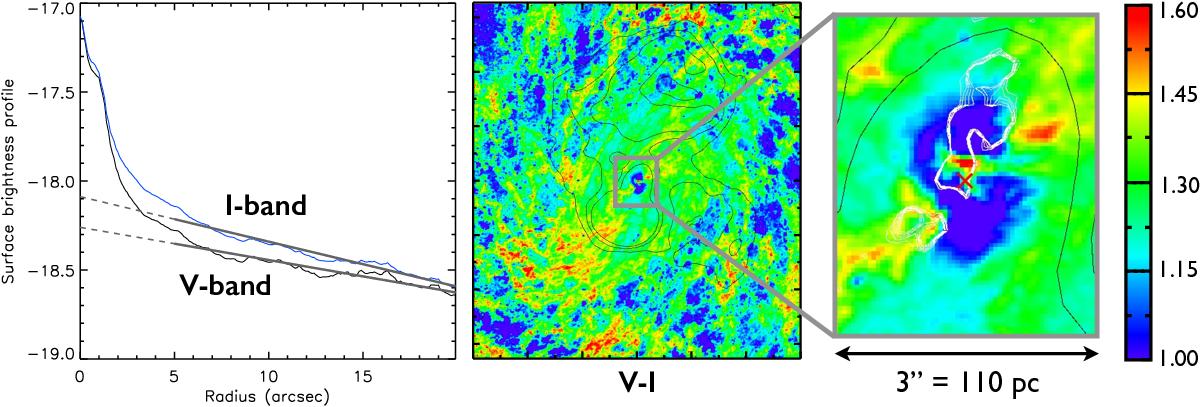
From left to right: radial profile of surface brightness in the HST I-band and V-band, in units of mag/arcsec2; V−I colour map of the same field of view shown before, 30′′ × 33′′, with large tickmarks indicating a separation of 5′′ (in linear scale from 1.0 to 1.6); blowup of the central area, where the “bump” is originating from (overlaid with Hα contours in white; the black contours correspond to the radio jet traced by 20 cm continuum).
Current usage metrics show cumulative count of Article Views (full-text article views including HTML views, PDF and ePub downloads, according to the available data) and Abstracts Views on Vision4Press platform.
Data correspond to usage on the plateform after 2015. The current usage metrics is available 48-96 hours after online publication and is updated daily on week days.
Initial download of the metrics may take a while.