Fig. 12
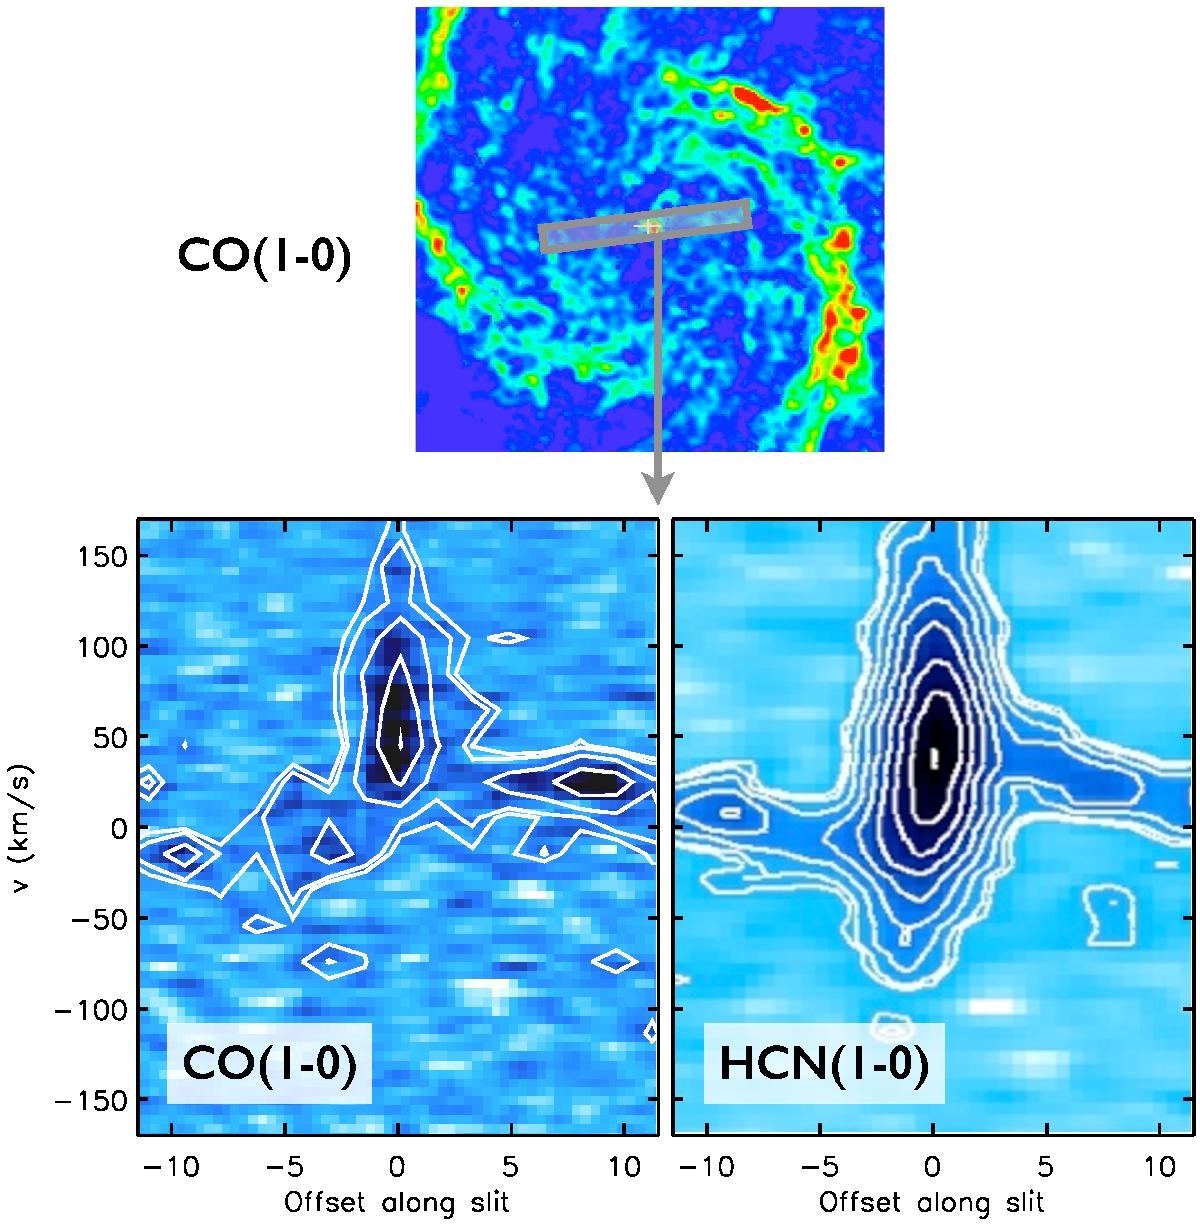
Integrated intensity map of our PAWS (PdBI Arcsecond Whirlpool Survey) CO(1−0) cube at 1′′ resolution, with an indication of the slit used for the p−v diagrams shown next. Position-velocity diagrams extracted along a PA =273°, for CO (1′′ resolution) and HCN (4′′), in which the redshifted wings of the outflow become manifest (with a blueshifted counterpart hinting in HCN).
Current usage metrics show cumulative count of Article Views (full-text article views including HTML views, PDF and ePub downloads, according to the available data) and Abstracts Views on Vision4Press platform.
Data correspond to usage on the plateform after 2015. The current usage metrics is available 48-96 hours after online publication and is updated daily on week days.
Initial download of the metrics may take a while.