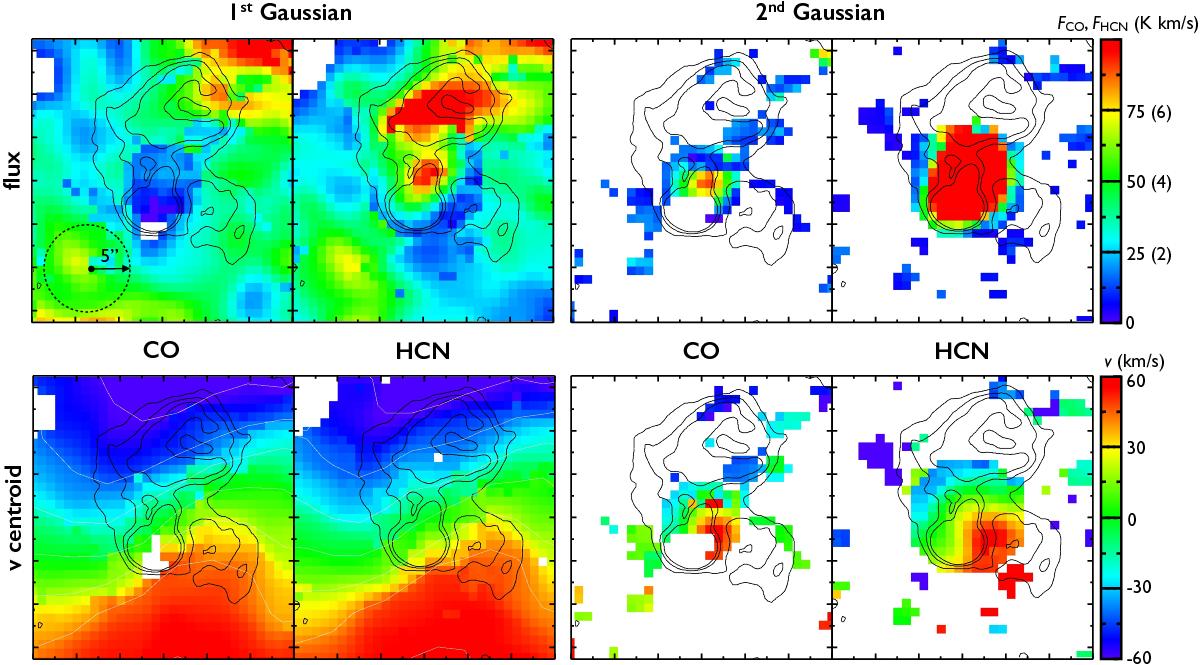
Fig. 11

Flux and velocity centroid of the Gaussians fitted on a pixel-by-pixel basis to the CO and HCN profiles (Sect. 3.2.2). The top row shows the integrated flux of the first (main) and second Gaussians, while the bottom row shows the corresponding velocity centroids. The white isovelocity contours displayed on the velocity maps cover the range [−60, 60] km s-1, in intervals of 20 km s-1. The colourbar and scales covered are shown in the right (in parenthesis for HCN). All maps show the same field of view, 30′′ × 33′′, with large tickmarks indicating a separation of 5′′. For reference, the dashed circle on the top-left panel has a radius of 5′′ (185 pc).
Current usage metrics show cumulative count of Article Views (full-text article views including HTML views, PDF and ePub downloads, according to the available data) and Abstracts Views on Vision4Press platform.
Data correspond to usage on the plateform after 2015. The current usage metrics is available 48-96 hours after online publication and is updated daily on week days.
Initial download of the metrics may take a while.


