Free Access
Fig. 8
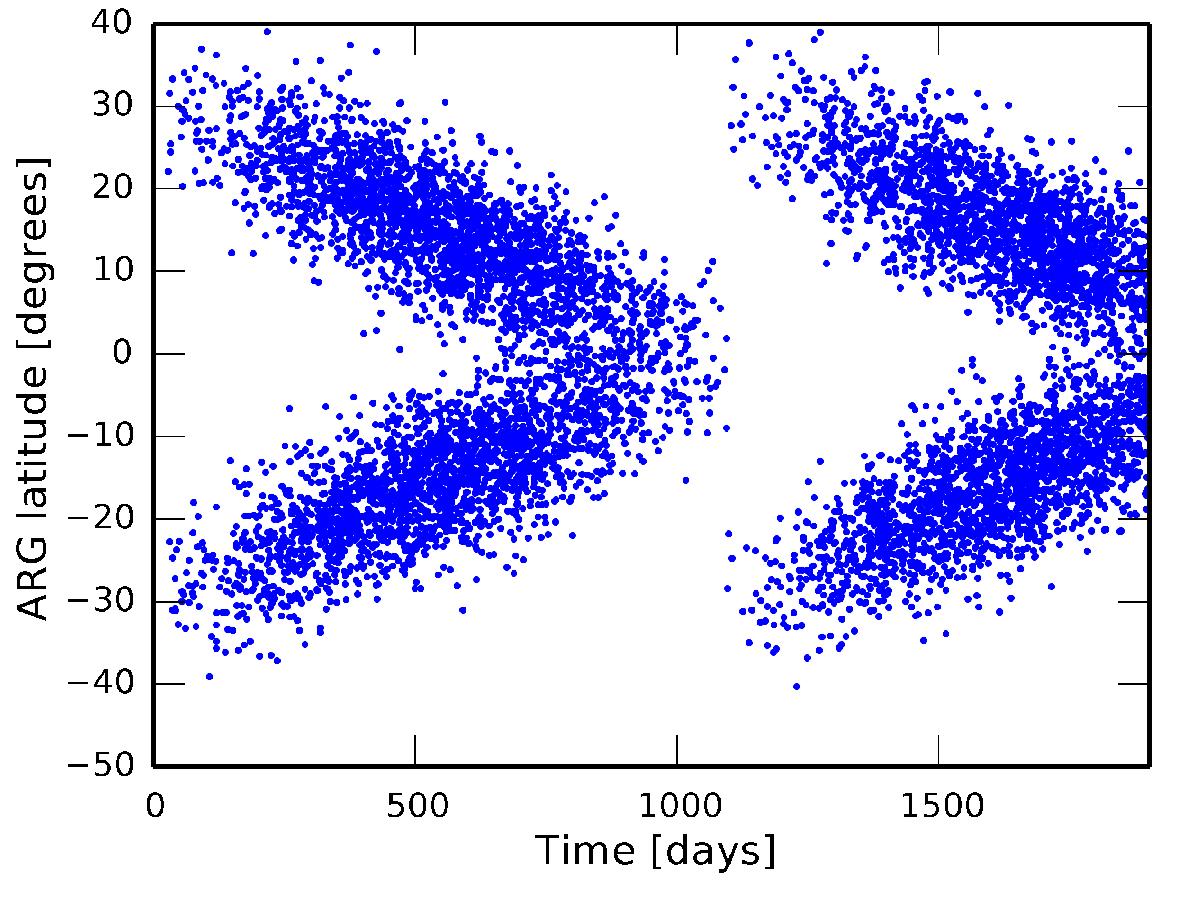
Butterfly diagram showing the latitude of the ARGs as a function of time. During the three years of the magnetic cycle simulated here, the active regions migrate from a latitude of 30 degrees to the equator. The new cycle begins when ARGs again appear at high latitude.
Current usage metrics show cumulative count of Article Views (full-text article views including HTML views, PDF and ePub downloads, according to the available data) and Abstracts Views on Vision4Press platform.
Data correspond to usage on the plateform after 2015. The current usage metrics is available 48-96 hours after online publication and is updated daily on week days.
Initial download of the metrics may take a while.