Fig. 7
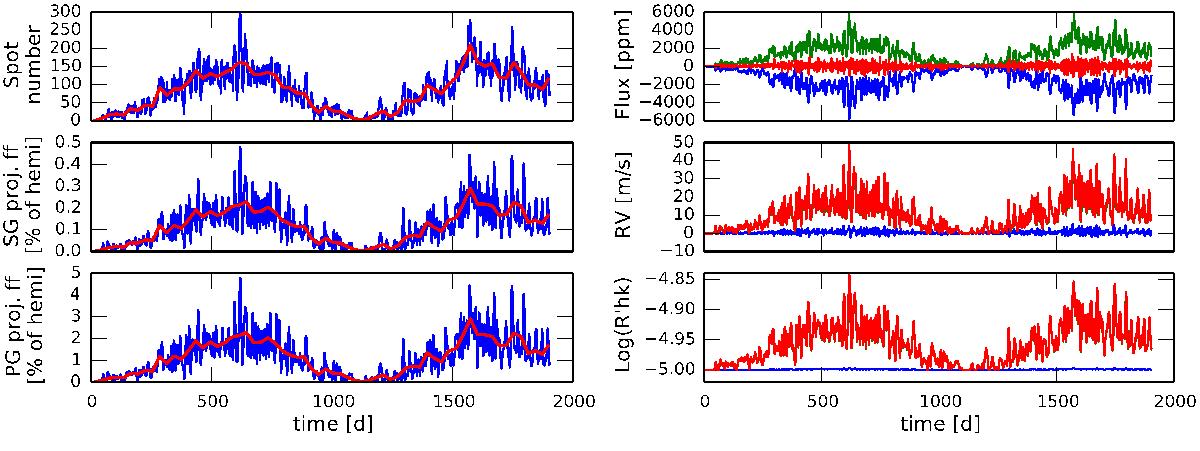
Simulated solar-like magnetic cycle, with a period set to three years. Left: variation as a function of time of the total number of spots and of the projected filling factor of spot groups (SGs) and plage groups (PGs). The red line represents a monthly smoothing of the data. Right: flux, RV, and log (![]() ) variations as a function of time. Blue corresponds to the effect of spot groups, green to the effect of plage groups, and red to the combined effect. For the RV and the log (
) variations as a function of time. Blue corresponds to the effect of spot groups, green to the effect of plage groups, and red to the combined effect. For the RV and the log (![]() ), the red line overlaps the green one, implying that the variation of these observables is fully dominated by plage groups.
), the red line overlaps the green one, implying that the variation of these observables is fully dominated by plage groups.
Current usage metrics show cumulative count of Article Views (full-text article views including HTML views, PDF and ePub downloads, according to the available data) and Abstracts Views on Vision4Press platform.
Data correspond to usage on the plateform after 2015. The current usage metrics is available 48-96 hours after online publication and is updated daily on week days.
Initial download of the metrics may take a while.