Fig. 3
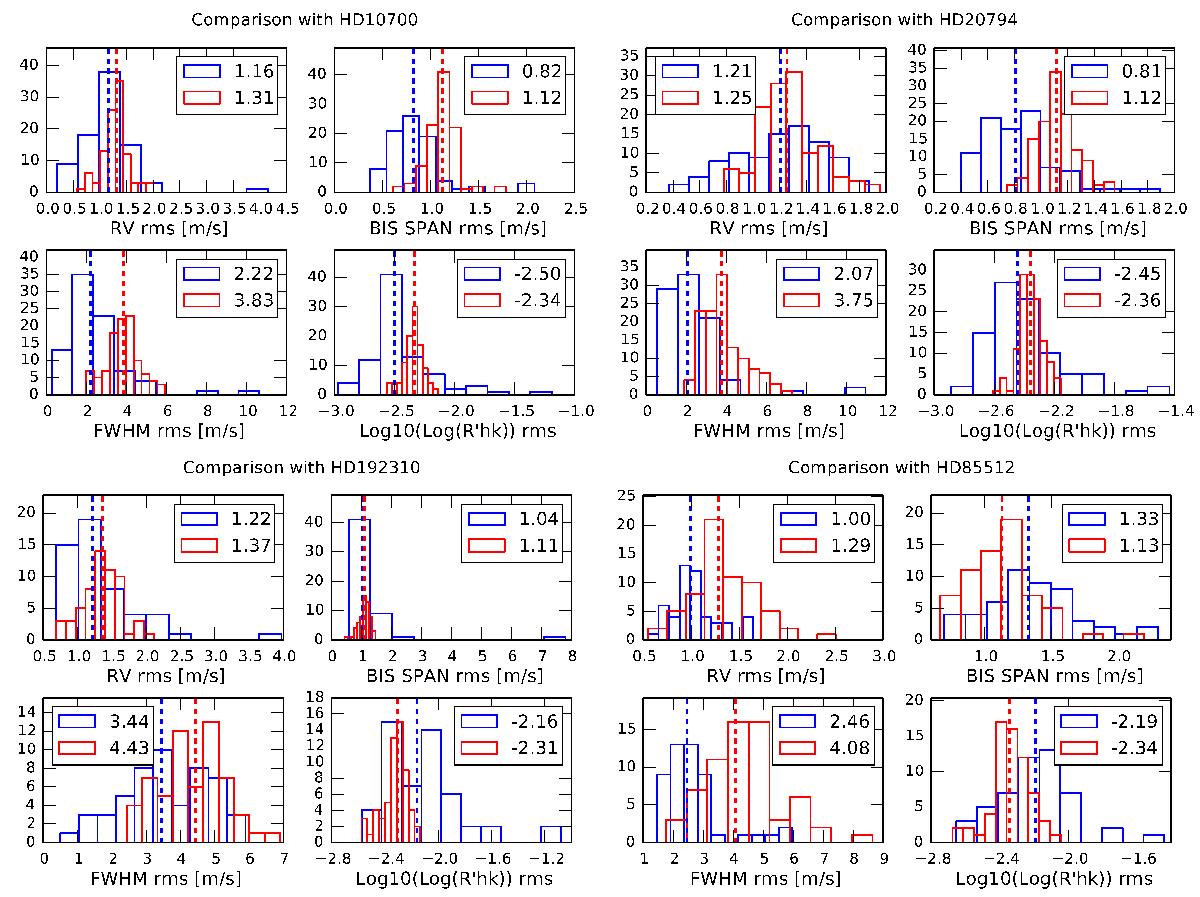
Comparison between the simulated and real data for τ Ceti (HD 10700), HD 20794, HD 192310, and HD 85512. For each star, the simulated data are generated with the same calendar as the observed measurements. We then compute the rms of the RVs, the BIS SPAN, the FWHM, and the log (![]() ) for chunks of ten consecutive days each, including at least seven observations. Each subplot shows the histogram of the rms computed based on the observed (blue) and simulated (red) data, with the corresponding median highlighted by the dashed vertical lines and its value reported in the legend. The agreement between the histograms and the median values demonstrates that the simulated data that include granulation signal, oscillation signal, and instrumental noise are similar to the real observations performed with HARPS.
) for chunks of ten consecutive days each, including at least seven observations. Each subplot shows the histogram of the rms computed based on the observed (blue) and simulated (red) data, with the corresponding median highlighted by the dashed vertical lines and its value reported in the legend. The agreement between the histograms and the median values demonstrates that the simulated data that include granulation signal, oscillation signal, and instrumental noise are similar to the real observations performed with HARPS.

Current usage metrics show cumulative count of Article Views (full-text article views including HTML views, PDF and ePub downloads, according to the available data) and Abstracts Views on Vision4Press platform.
Data correspond to usage on the plateform after 2015. The current usage metrics is available 48-96 hours after online publication and is updated daily on week days.
Initial download of the metrics may take a while.