Fig. 1
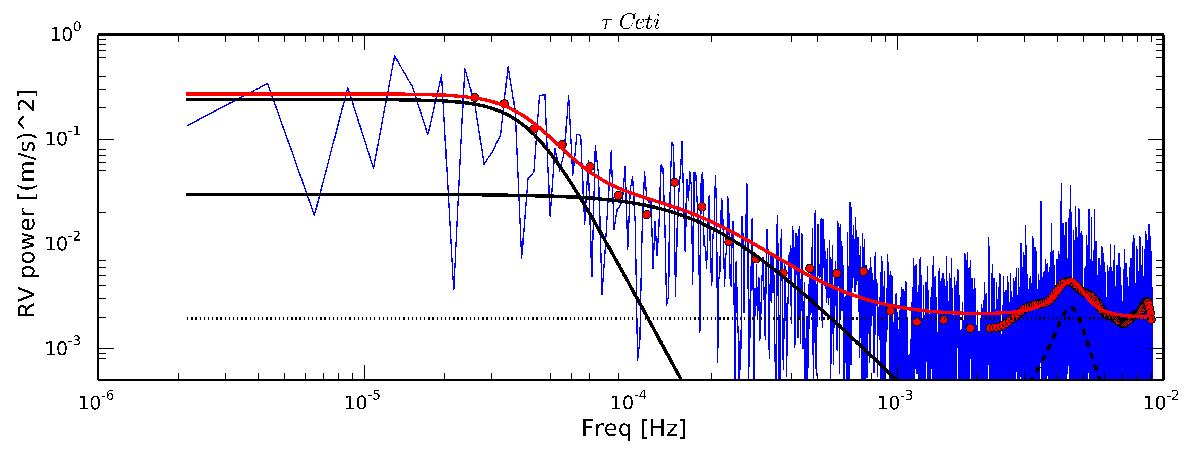
Raw RVs of τ Ceti in the frequency domain (blue line) and binned in frequency (red dots). The best fit to the data (red line), using the model presented in Eq. (1), is obtained considering two power laws to account for supergranulation and granulation (black continuous lines), a Lorentzian profile to account for stellar oscillations (dashed line), and a constant to include white instrumental noise (dotted line).
Current usage metrics show cumulative count of Article Views (full-text article views including HTML views, PDF and ePub downloads, according to the available data) and Abstracts Views on Vision4Press platform.
Data correspond to usage on the plateform after 2015. The current usage metrics is available 48-96 hours after online publication and is updated daily on week days.
Initial download of the metrics may take a while.