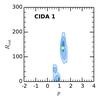
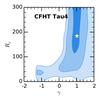
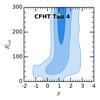
Fig. B.1
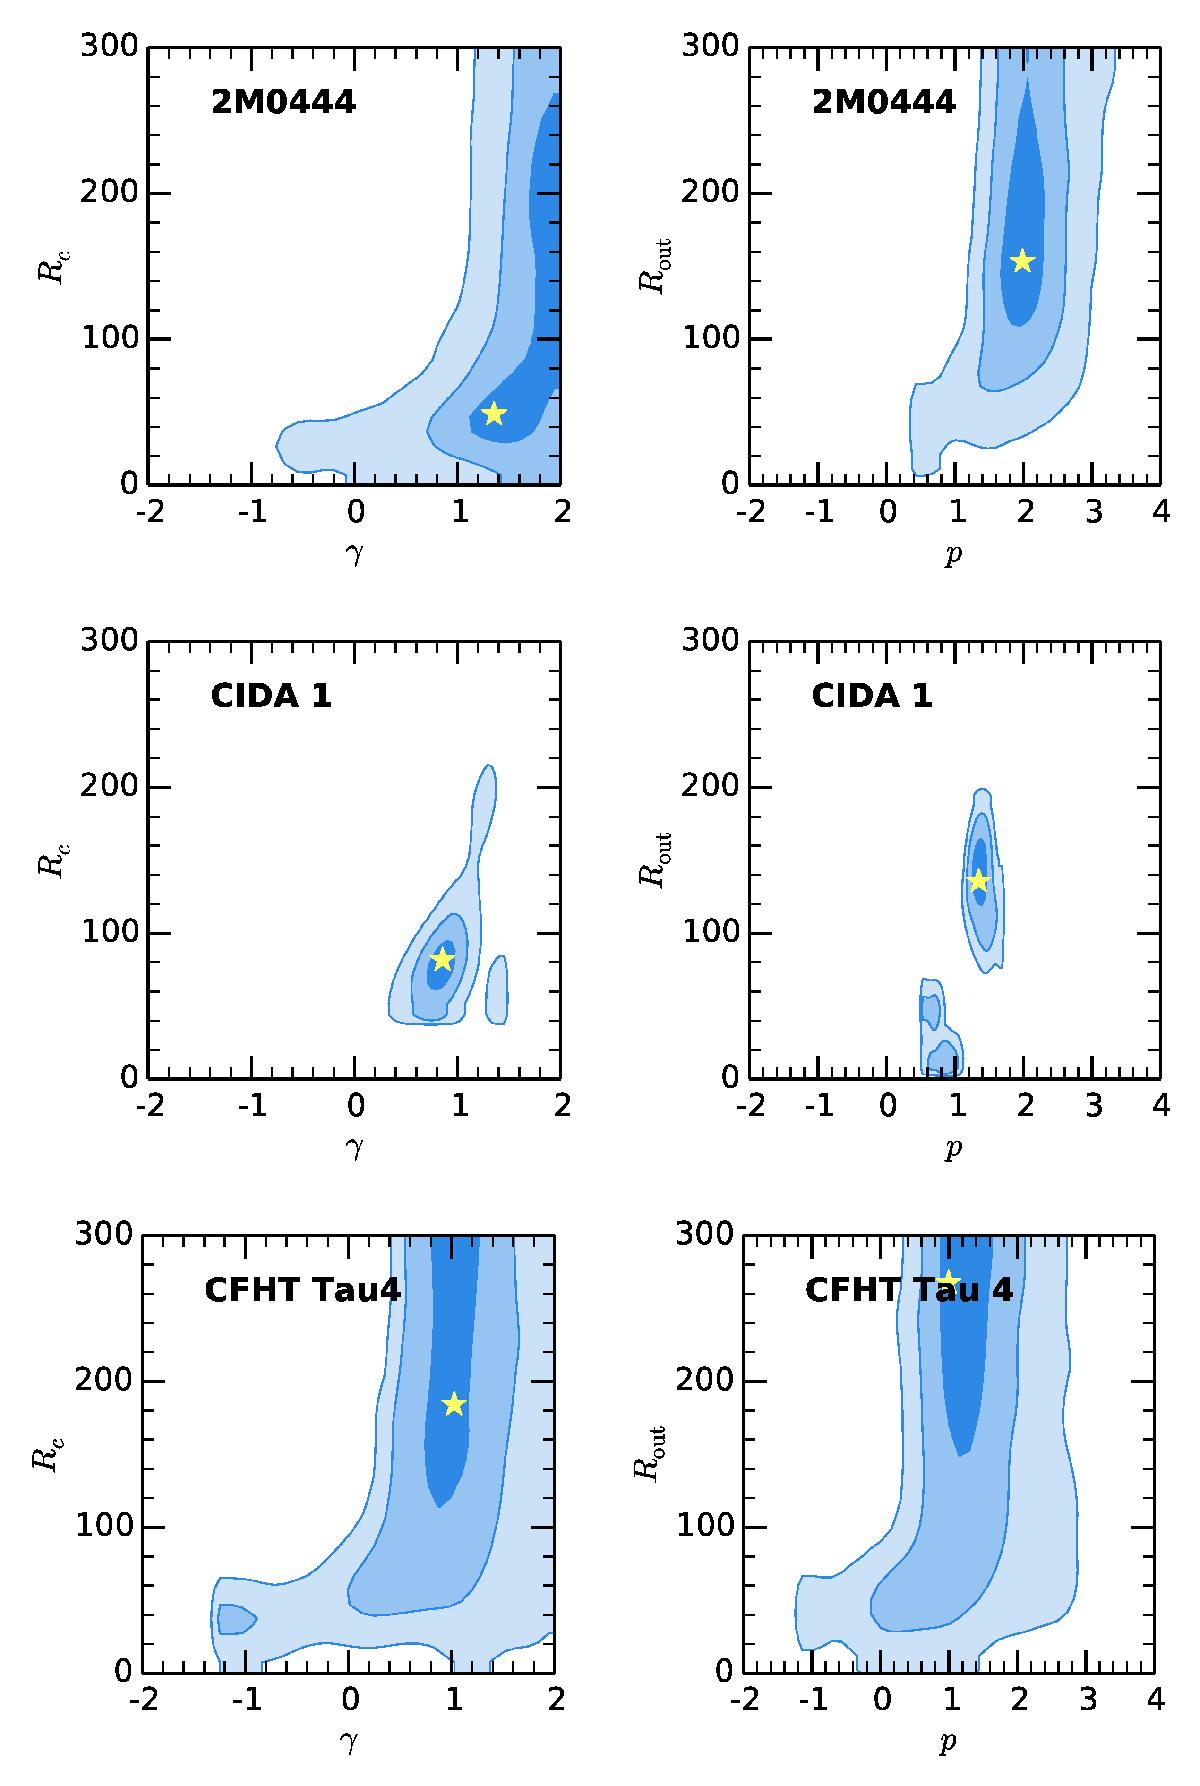
Two-dimensional distributions of the model parameters {Rc, γ} (left column) and {Rout, p} (right column) for the model fits of the disks in 2M0444+2512 (top row), CIDA 1 (middle row), and CFHT Tau4 (bottom row). The different shaded areas correspond to the 1, 2 and 3σ confidence levels (from light to dark blue), as in Fig. 2. The yellow stars mark the parameter values for the models plotted in Fig. B.2.
Current usage metrics show cumulative count of Article Views (full-text article views including HTML views, PDF and ePub downloads, according to the available data) and Abstracts Views on Vision4Press platform.
Data correspond to usage on the plateform after 2015. The current usage metrics is available 48-96 hours after online publication and is updated daily on week days.
Initial download of the metrics may take a while.