Fig. 3
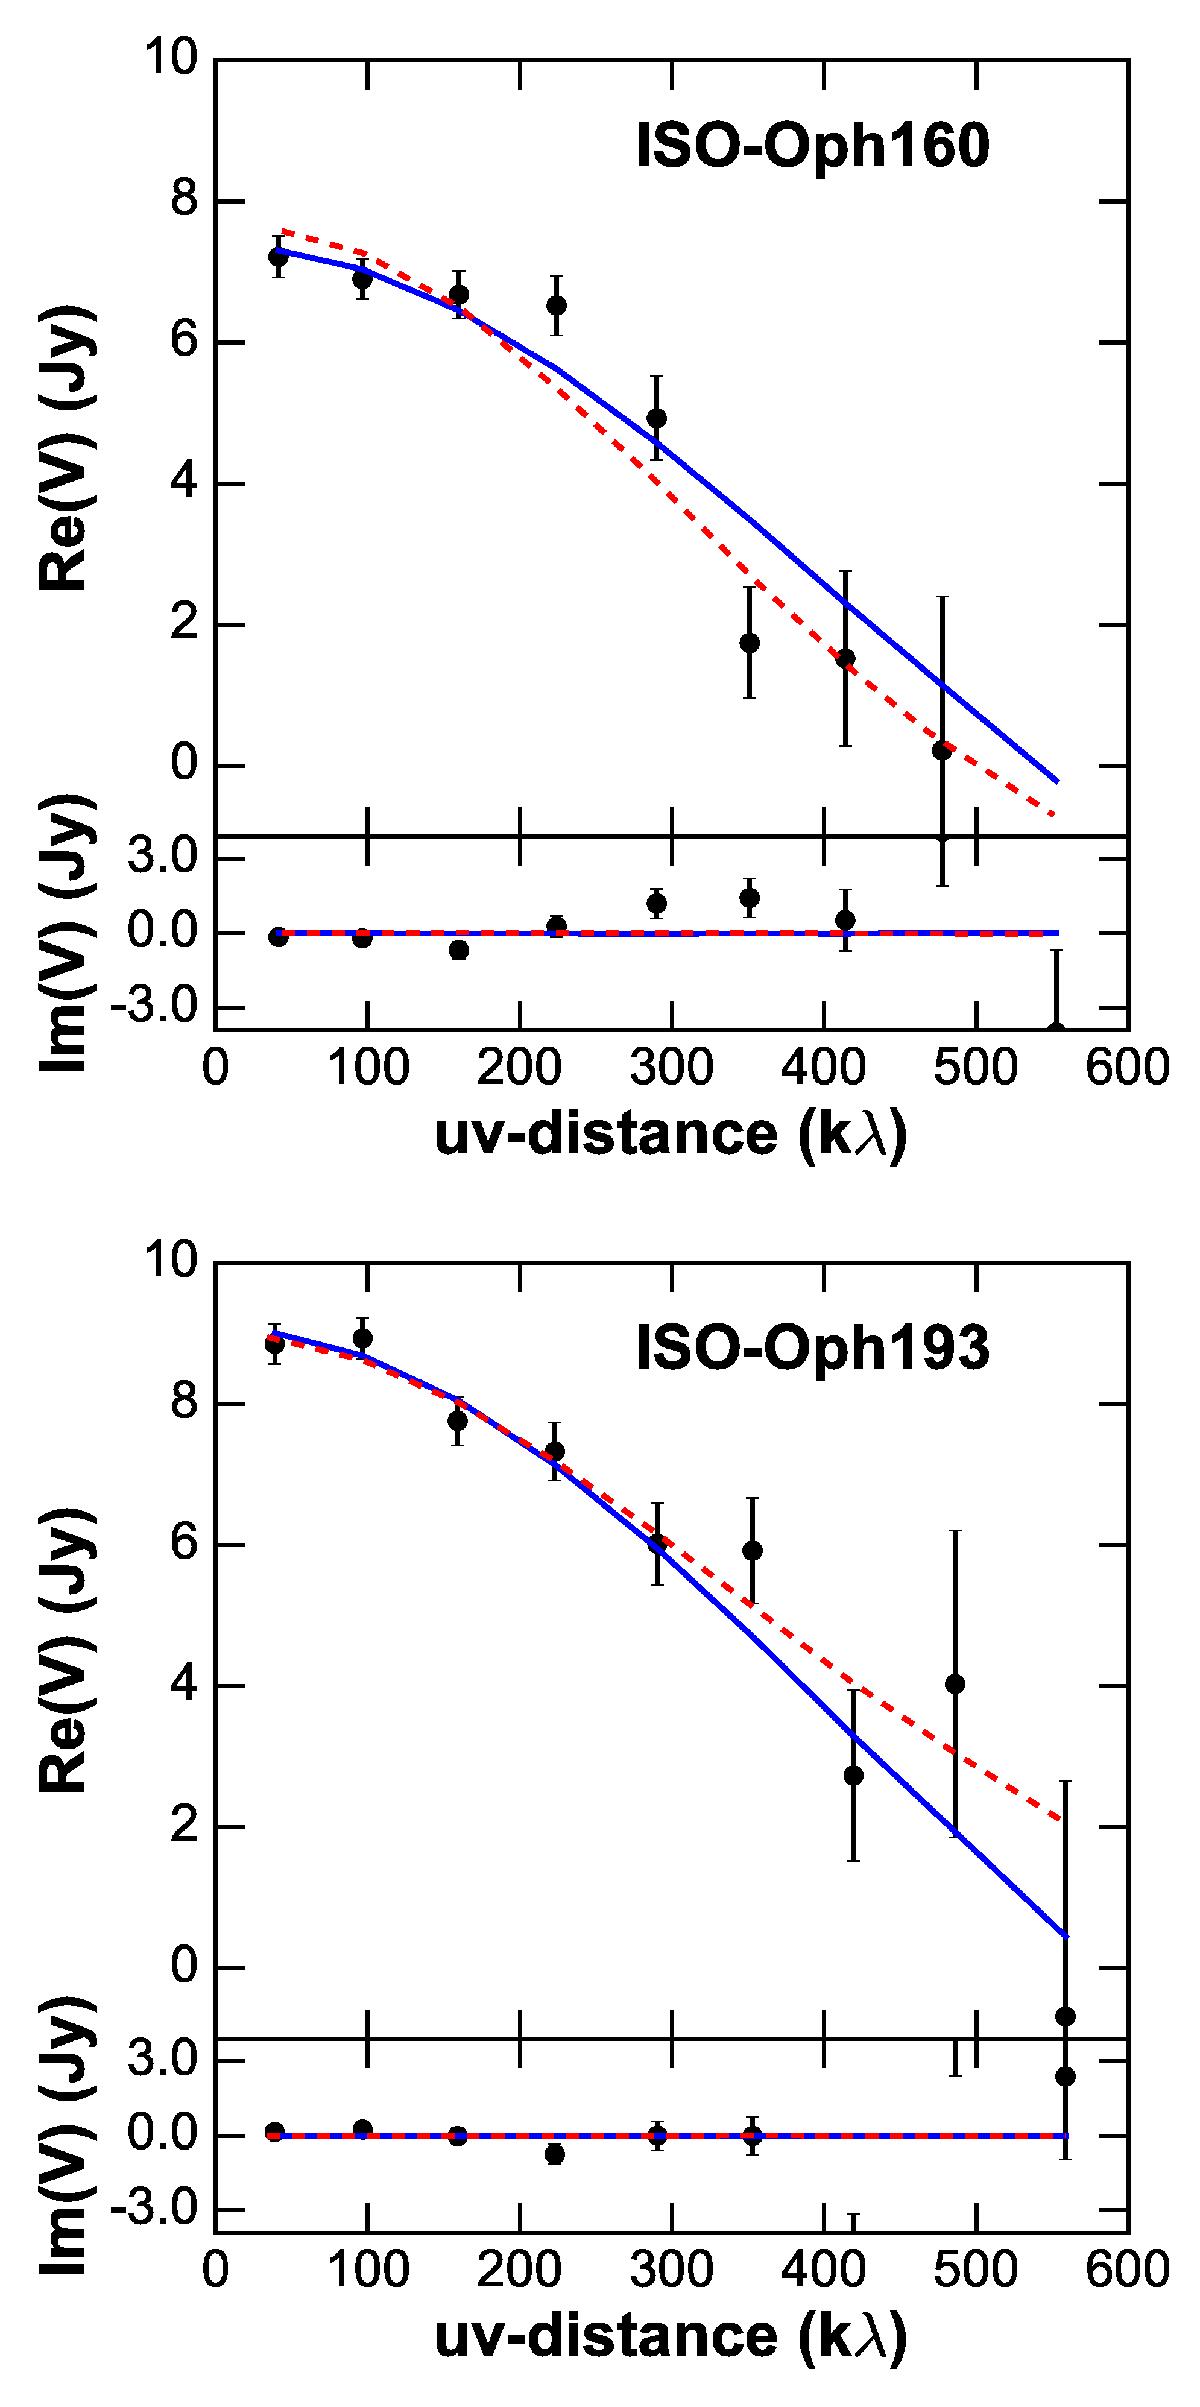
Real (top subpanel) and imaginary (bottom subpanel) visibilities as a function of baseline length for ISO-Oph160 (top figure) and ISO-Oph193 (bottom figure). The ALMA points were binned to increase the signal-to-noise ratio. The curves show the best-fitting models: the truncated power law Σ model as a solid blue line and the exponentially tapered model as a red dashed line.
Current usage metrics show cumulative count of Article Views (full-text article views including HTML views, PDF and ePub downloads, according to the available data) and Abstracts Views on Vision4Press platform.
Data correspond to usage on the plateform after 2015. The current usage metrics is available 48-96 hours after online publication and is updated daily on week days.
Initial download of the metrics may take a while.