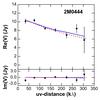
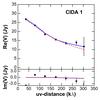
Fig. B.2
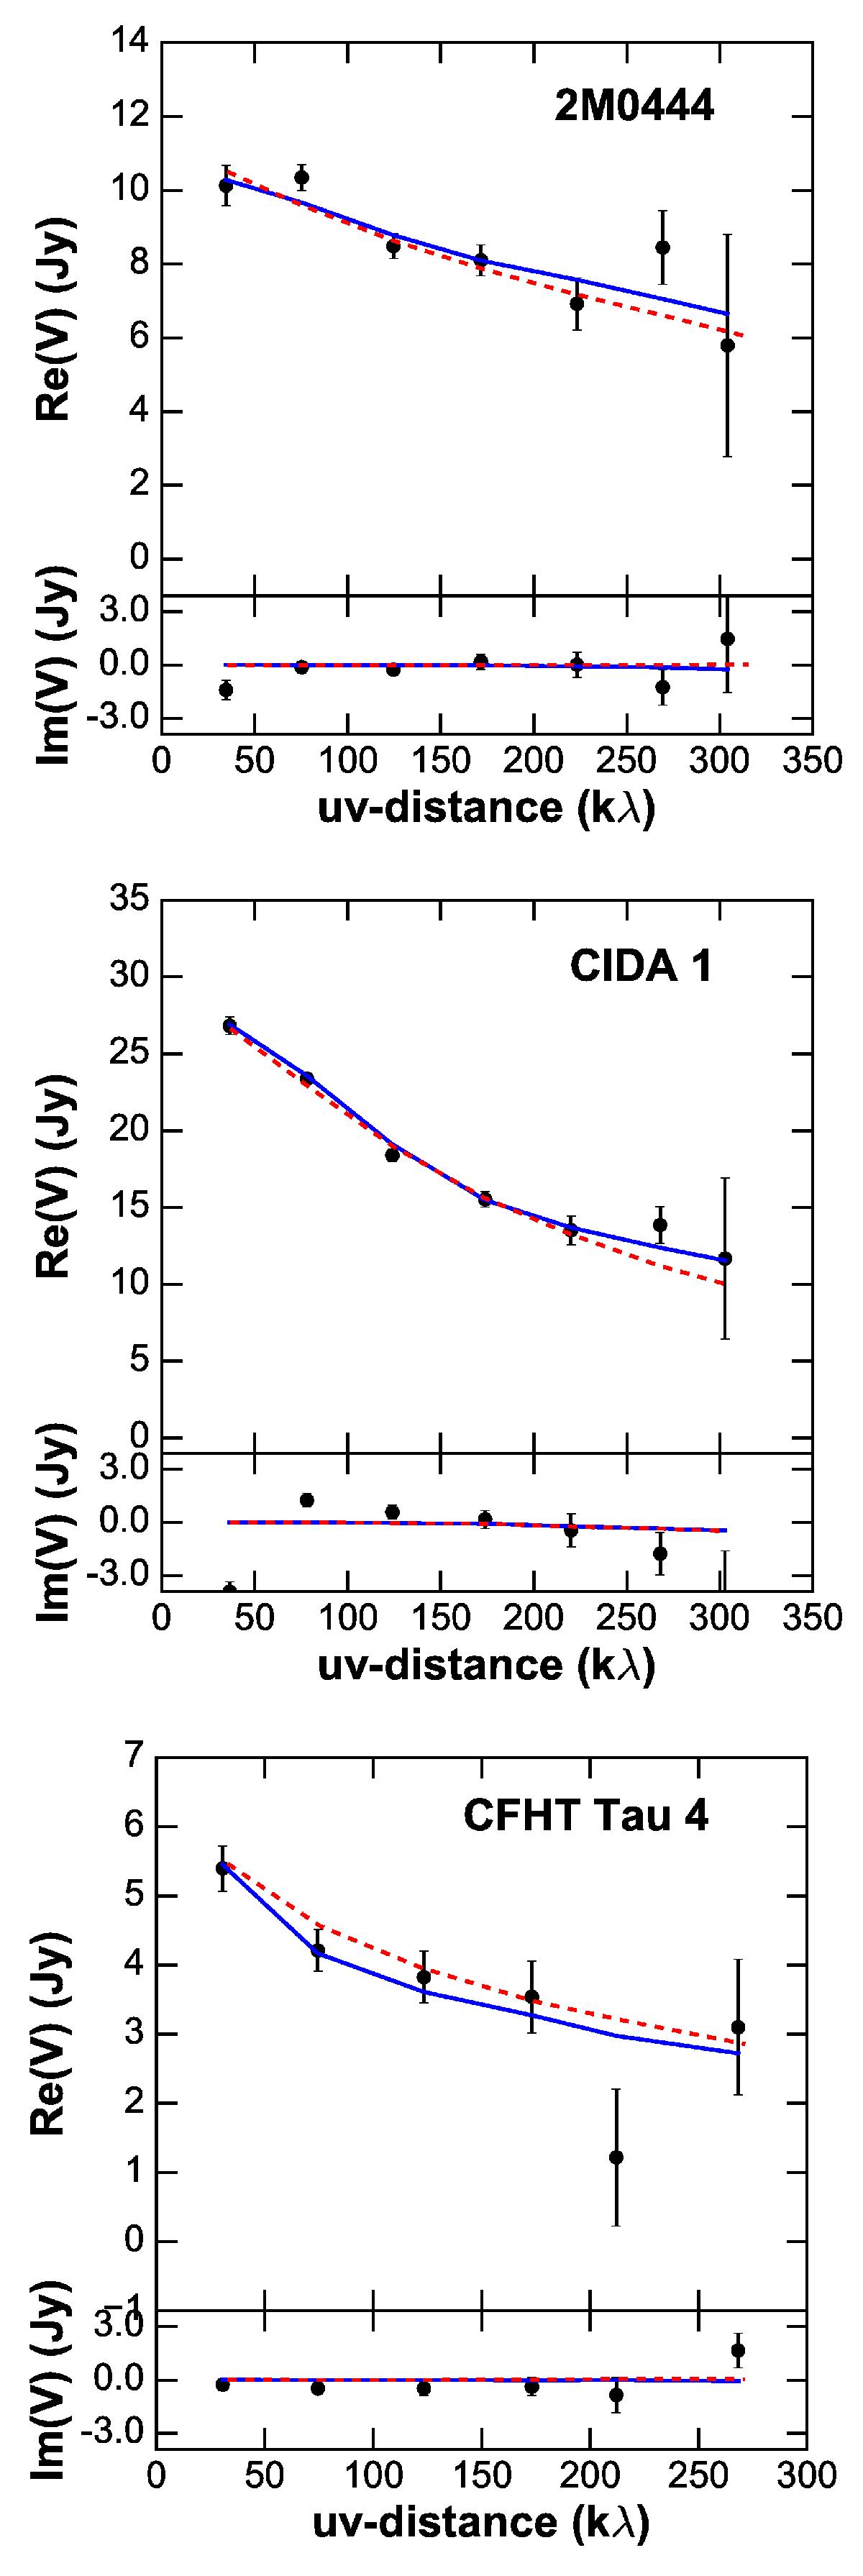
Comparison between observed and model visibilities for the model fits of the disks in 2M0444+2512 (top row), CIDA 1 (middle row), and CFHT Tau4 (bottom row). ALMA data is shown as black circles with errorbars, truncated power law and esponentially tapered models with blue and red lines, respectively, as in Fig. 3.
This figure is made of several images, please see below:
Current usage metrics show cumulative count of Article Views (full-text article views including HTML views, PDF and ePub downloads, according to the available data) and Abstracts Views on Vision4Press platform.
Data correspond to usage on the plateform after 2015. The current usage metrics is available 48-96 hours after online publication and is updated daily on week days.
Initial download of the metrics may take a while.