Fig. 1
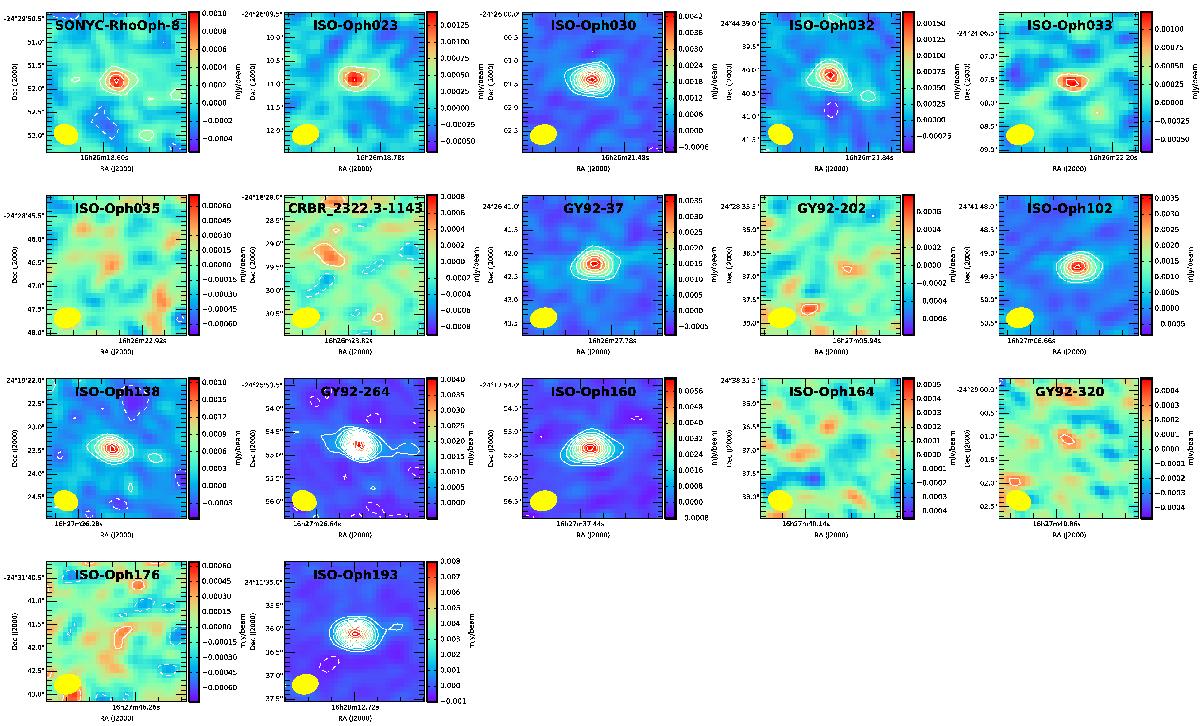
ALMA Band 7 images of all the observed sources, as labelled in each panel; each panel is 3′′ × 3′′ in size. The synthesized beam full width at half maximum is shown in the lower left corner of each panel; the typical size is ![]() . In each panel, contour levels are plot at −3σ (dashed), and every 3σ from 3σ to the maximum.
. In each panel, contour levels are plot at −3σ (dashed), and every 3σ from 3σ to the maximum.
Current usage metrics show cumulative count of Article Views (full-text article views including HTML views, PDF and ePub downloads, according to the available data) and Abstracts Views on Vision4Press platform.
Data correspond to usage on the plateform after 2015. The current usage metrics is available 48-96 hours after online publication and is updated daily on week days.
Initial download of the metrics may take a while.