Fig. 8
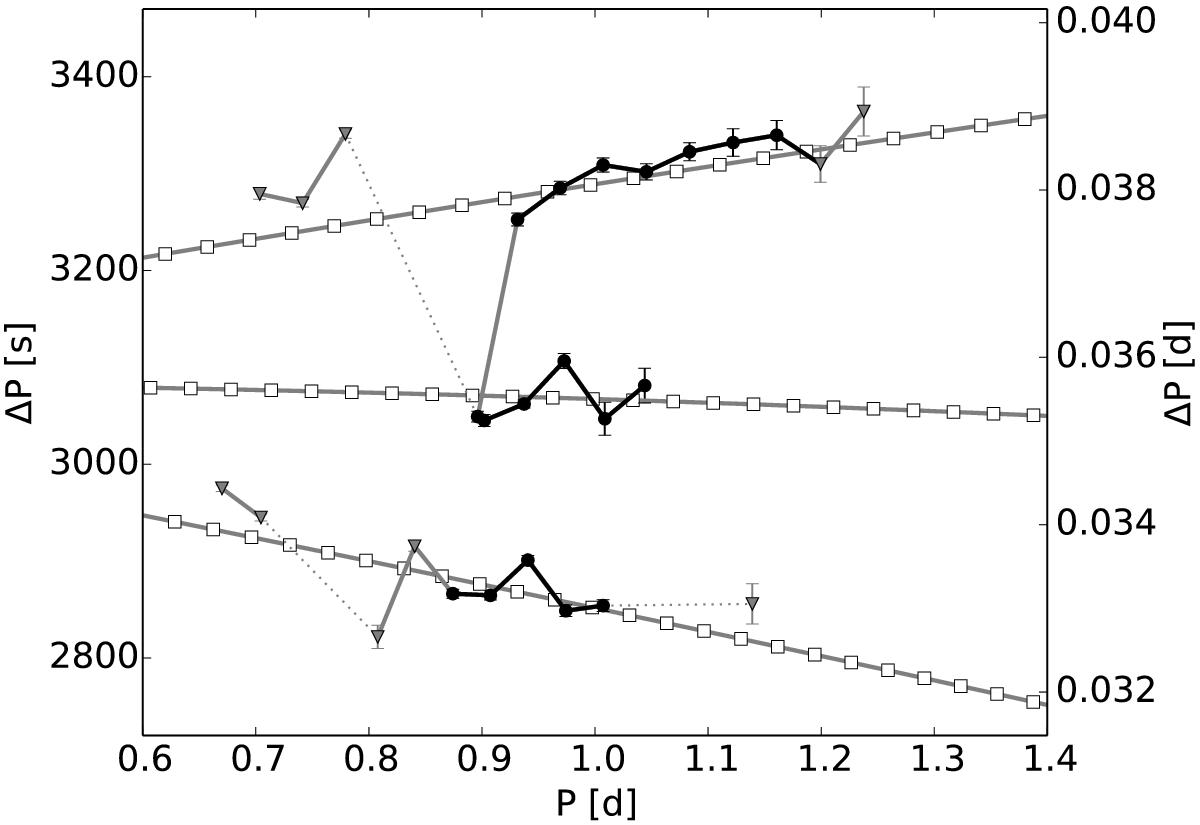
Observed period spacing patterns (black dots and grey triangles) for the retrograde (top), zonal (middle), and prograde (bottom) modes of KIC 9751996. The black parts of the input patterns were used to determine frot and ΔΠl, while the grey sections were excluded. The white squares indicate the modes of the optimal model in the grid when all three series are fitted simultaneously.
Current usage metrics show cumulative count of Article Views (full-text article views including HTML views, PDF and ePub downloads, according to the available data) and Abstracts Views on Vision4Press platform.
Data correspond to usage on the plateform after 2015. The current usage metrics is available 48-96 hours after online publication and is updated daily on week days.
Initial download of the metrics may take a while.