Fig. 4
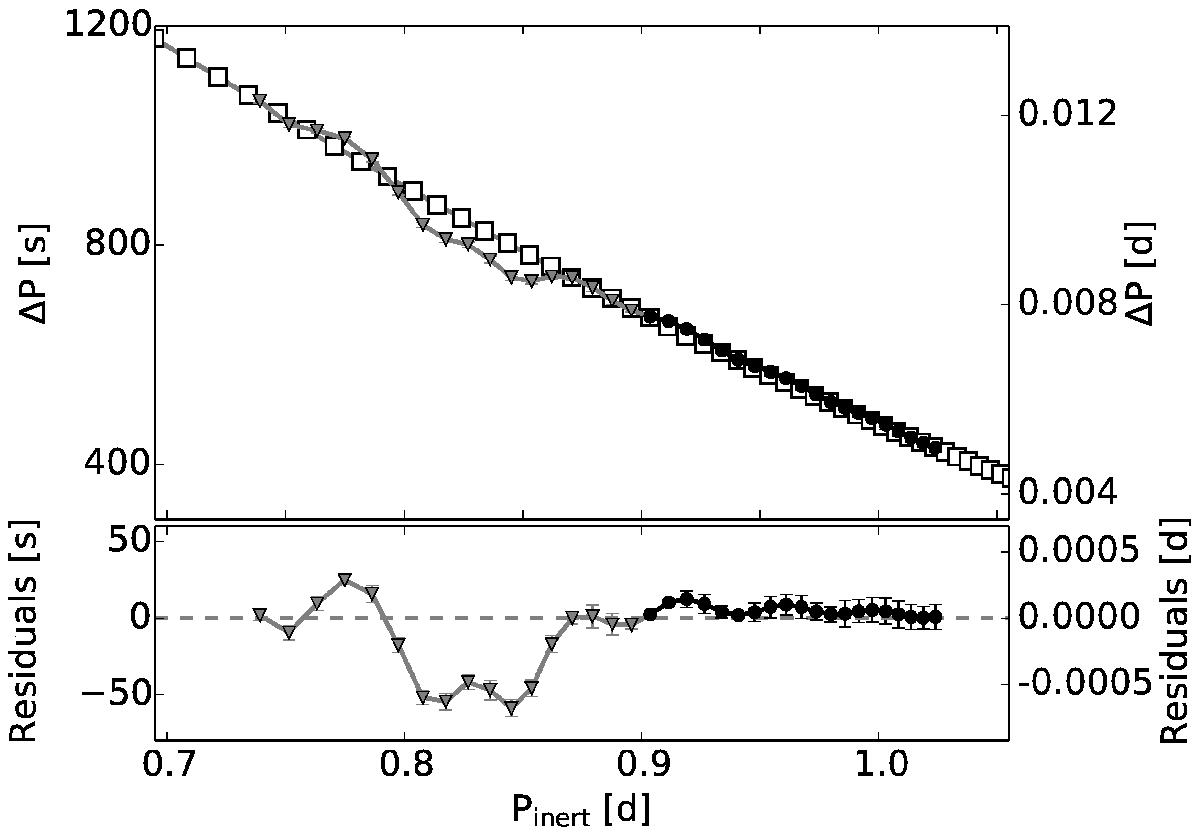
Top: the input period spacing pattern (black dots and grey triangles) with the best-fitting pattern (white squares) as obtained from the χ2-minimisation in Fig. 6 assuming (l, m) = (1, 1). The black part of the input patterns was used to determine frot and ΔΠl, while the grey section was excluded. Bottom: the residuals of the fit.
Current usage metrics show cumulative count of Article Views (full-text article views including HTML views, PDF and ePub downloads, according to the available data) and Abstracts Views on Vision4Press platform.
Data correspond to usage on the plateform after 2015. The current usage metrics is available 48-96 hours after online publication and is updated daily on week days.
Initial download of the metrics may take a while.