Fig. 14
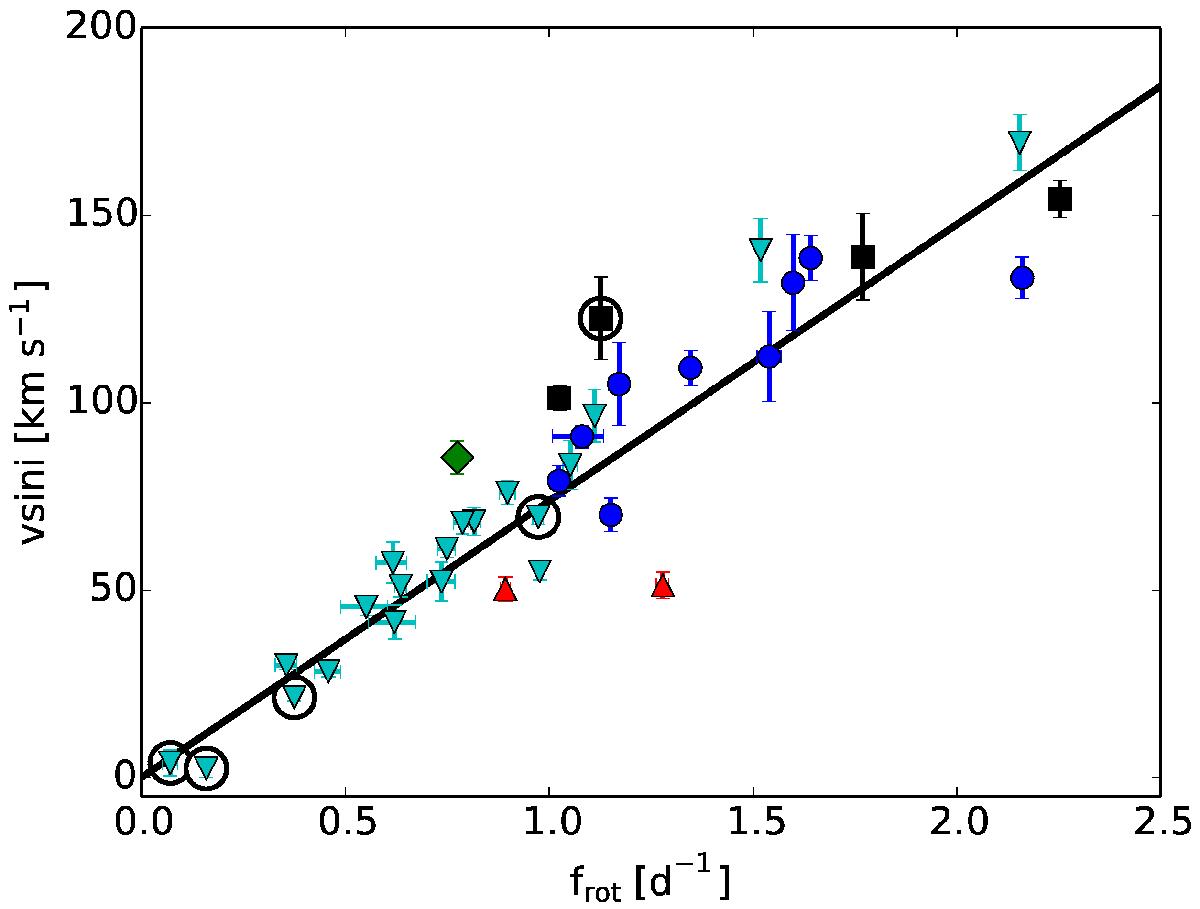
Correlation between the spectroscopic vsini values and the values of the rotation rate frot. The black line indicates the corresponding linear fit, for which the coefficients are listed in Table 3. The symbols are the same as in Fig. 11. For all of the stars a series of prograde dipole modes was detected. If another series was detected as well, the symbol of the corresponding mode identification was used.
Current usage metrics show cumulative count of Article Views (full-text article views including HTML views, PDF and ePub downloads, according to the available data) and Abstracts Views on Vision4Press platform.
Data correspond to usage on the plateform after 2015. The current usage metrics is available 48-96 hours after online publication and is updated daily on week days.
Initial download of the metrics may take a while.