Fig. 11
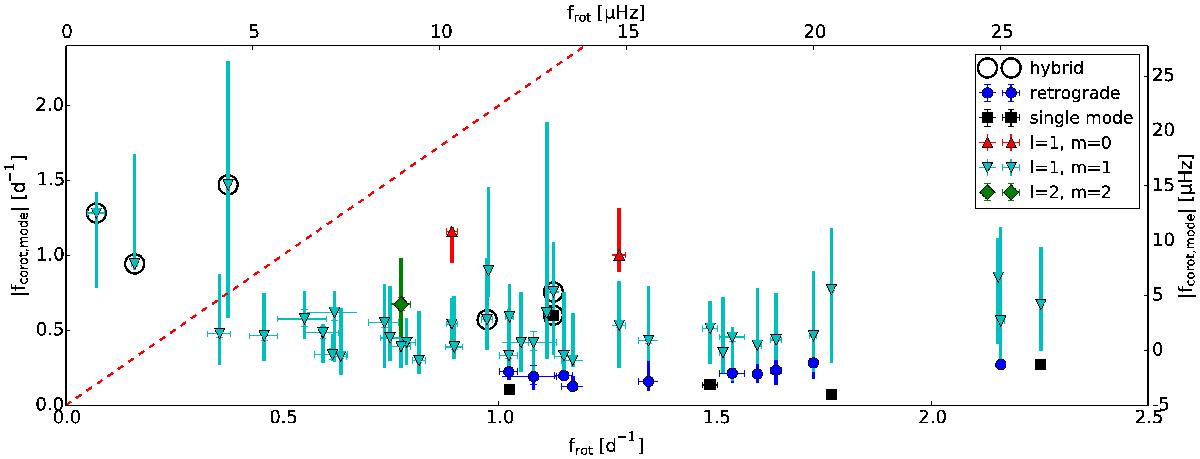
Dominant pulsation frequency fdom,corot in the corotating frame as a function of the rotation frequency frot for the identified g-mode pulsations of 40 stars in the sample. The thick vertical lines indicate the full extent of the detected spacing series. The dashed red line shows where the pulsations pass from the superinertial regime (above the line) into the subinertial regime (below the line).
Current usage metrics show cumulative count of Article Views (full-text article views including HTML views, PDF and ePub downloads, according to the available data) and Abstracts Views on Vision4Press platform.
Data correspond to usage on the plateform after 2015. The current usage metrics is available 48-96 hours after online publication and is updated daily on week days.
Initial download of the metrics may take a while.