Free Access
Fig. 10
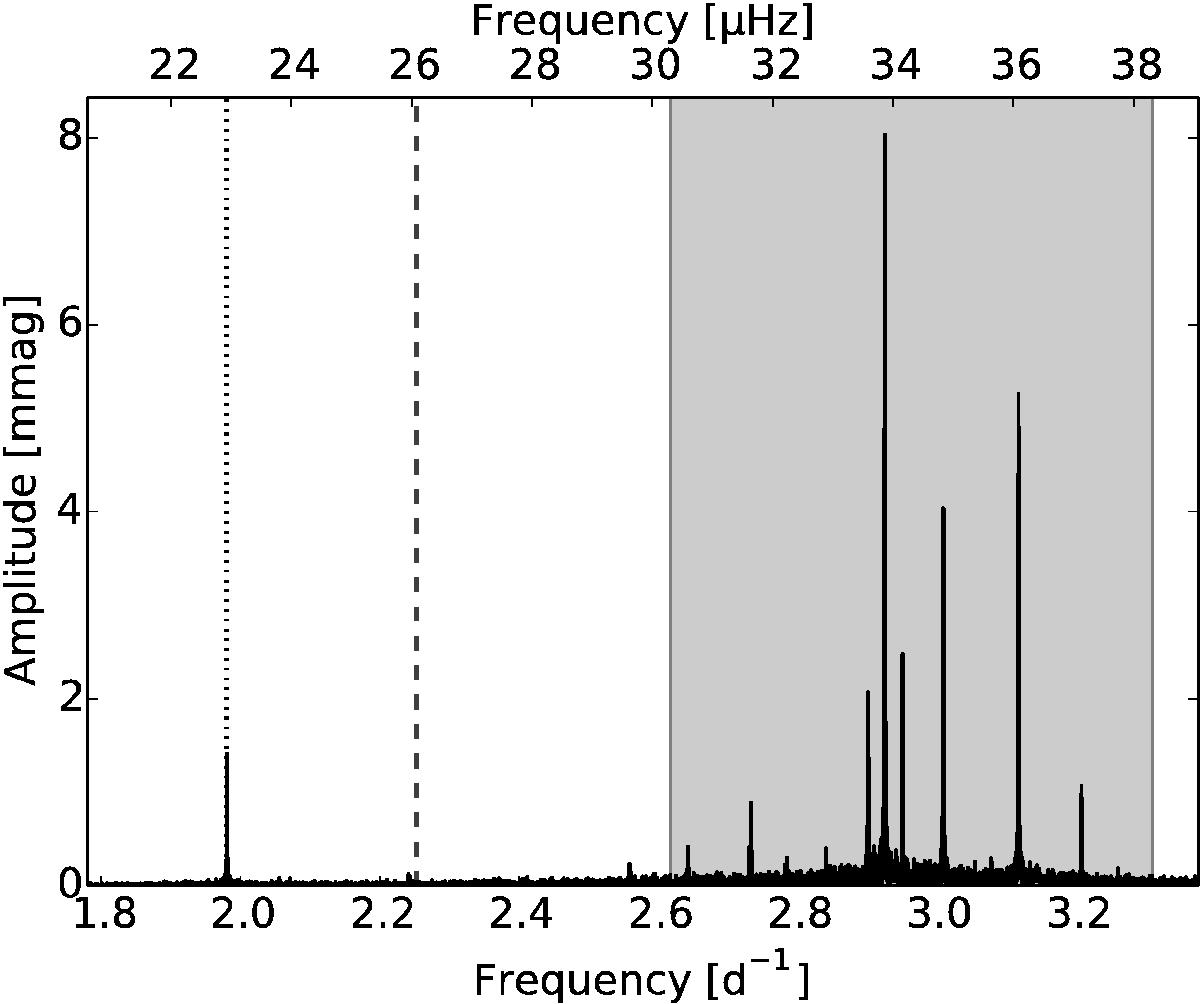
Part of the frequency spectrum of KIC 7365537. The light grey area shows the location of the pulsation modes that form the detected period spacing pattern of this star. The dashed line shows the value of the derived rotation frequency frot, while the dotted line indicates the solitary high-amplitude mode we found.
Current usage metrics show cumulative count of Article Views (full-text article views including HTML views, PDF and ePub downloads, according to the available data) and Abstracts Views on Vision4Press platform.
Data correspond to usage on the plateform after 2015. The current usage metrics is available 48-96 hours after online publication and is updated daily on week days.
Initial download of the metrics may take a while.