Free Access
Fig. B.1
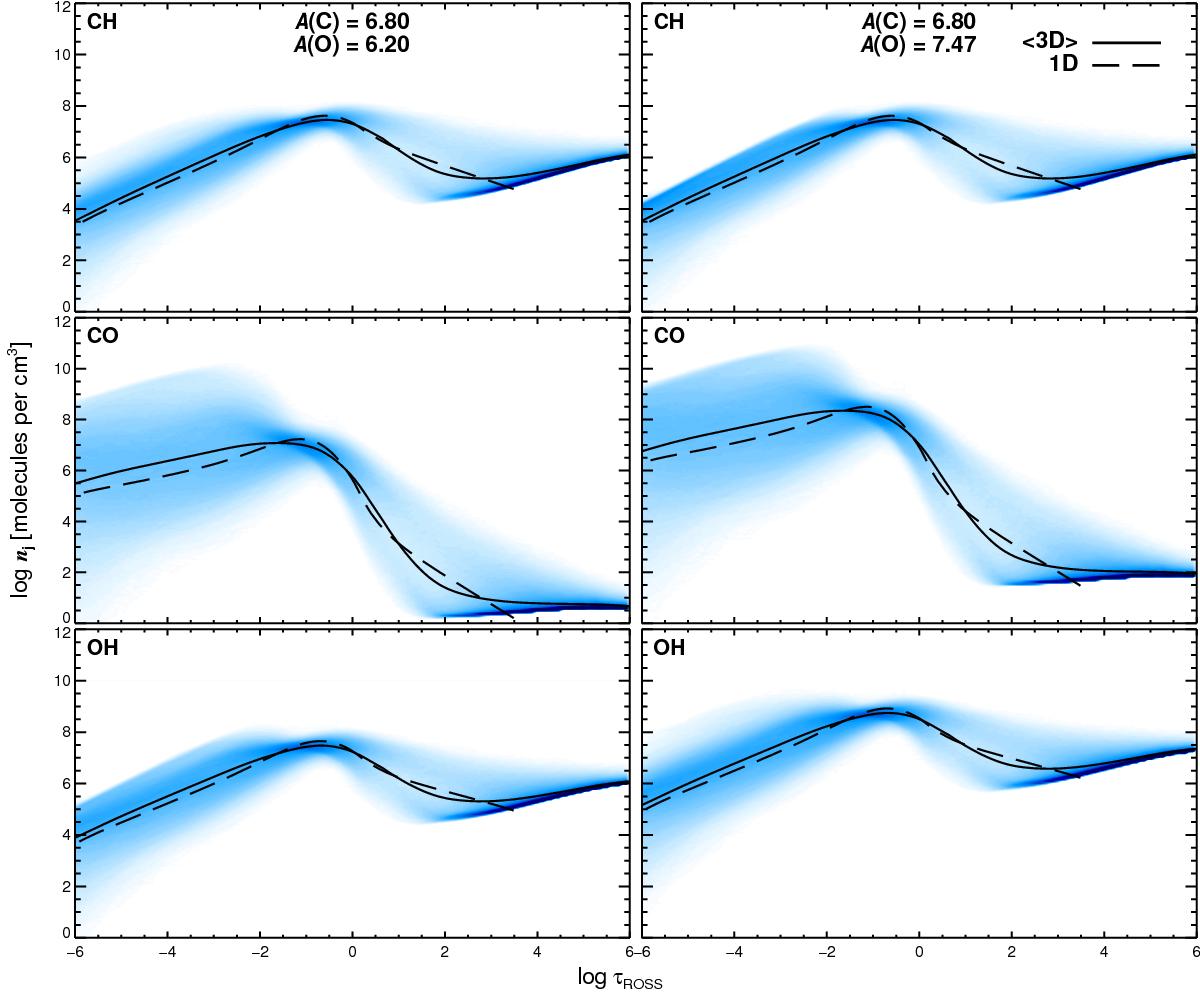
Corresponding [Fe/H] = −1.0 molecular number density plot to the one presented in Fig. 2. The large differences in OH, CH and CO formation seen between the 3D and 1D LHD have almost completely disappeared.
Current usage metrics show cumulative count of Article Views (full-text article views including HTML views, PDF and ePub downloads, according to the available data) and Abstracts Views on Vision4Press platform.
Data correspond to usage on the plateform after 2015. The current usage metrics is available 48-96 hours after online publication and is updated daily on week days.
Initial download of the metrics may take a while.