Fig. 1
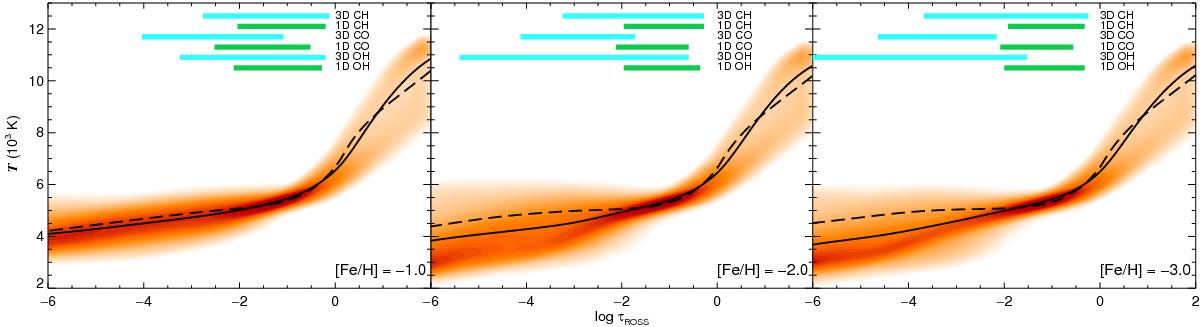
Temperature structures of the 3D CO5BOLD (orange density map), ⟨3D⟩ (solid black line) and 1D LHD (dashed black line) for the d3t63g40mm10n02, d3t63g40mm20n03 and d3t63g40mm30n02 model atmospheres. Darker regions of the density map indicate more frequently sampled temperatures. The 1D LHD model atmospheres are computed assuming αMLT = 1.0. Contribution functions of a low-excitation CH, CO and OH line computed in 3D (light blue) and 1D (green) are included to demonstrate the differences between the 3D and 1D LHD forming regions and how the metallicity impacts the depth of formation. Their CNO abundances are identical for all metallicities; A(C)3D = A(C)1D,LHD = 6.80, A(N)3D = A(N)1D,LHD = 6.21, A(O)3D = A(O)1D,LHD = 7.47.
Current usage metrics show cumulative count of Article Views (full-text article views including HTML views, PDF and ePub downloads, according to the available data) and Abstracts Views on Vision4Press platform.
Data correspond to usage on the plateform after 2015. The current usage metrics is available 48-96 hours after online publication and is updated daily on week days.
Initial download of the metrics may take a while.