Fig. 8
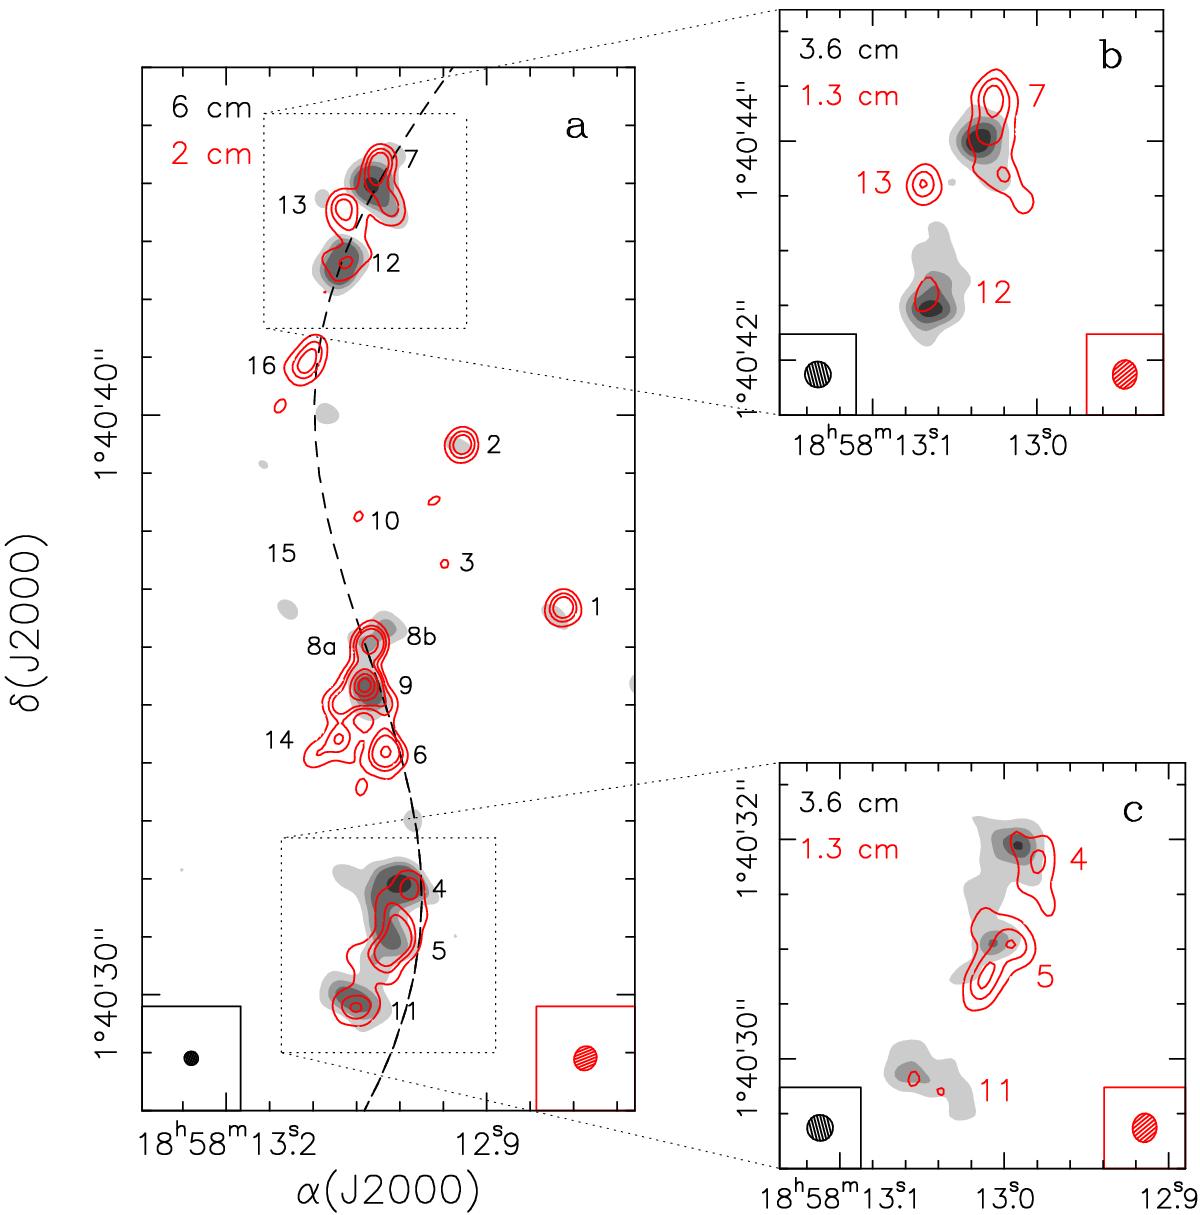
a) Overlay of the 2 cm continuum emission (red contours) observed in B configuration on the 6 cm continuum emission (grayscale) in A configuration from Gibb et al. (2003). Red contours are the same as in Fig. 1a. The grayscale levels are 1, 2, 3, and 6 times 0.1 mJy beam-1, the 3σ level of the map. The VLA 6 and 2 cm synthesized beam are shown in the lower left and lower right corner, respectively. The numbers correspond to the centimeter continuum sources in Table 3. The black dashed line indicates the possible trajectory of the wiggling jet. b) and c) Overlay of the 1.3 cm continuum emission (red contours) observed in B configuration on the 3.6 cm continuum emission (grayscale) in A configuration from Gibb et al. (2003). Red contours are the same as in Fig. 1b. The grayscale levels are 1, 2, 3, and 4 times 0.08 mJy beam-1, the 3σ level of the map. The VLA 3.6 and 1.3 cm synthesized beam are shown in the lower left and lower right corner, respectively.
Current usage metrics show cumulative count of Article Views (full-text article views including HTML views, PDF and ePub downloads, according to the available data) and Abstracts Views on Vision4Press platform.
Data correspond to usage on the plateform after 2015. The current usage metrics is available 48-96 hours after online publication and is updated daily on week days.
Initial download of the metrics may take a while.