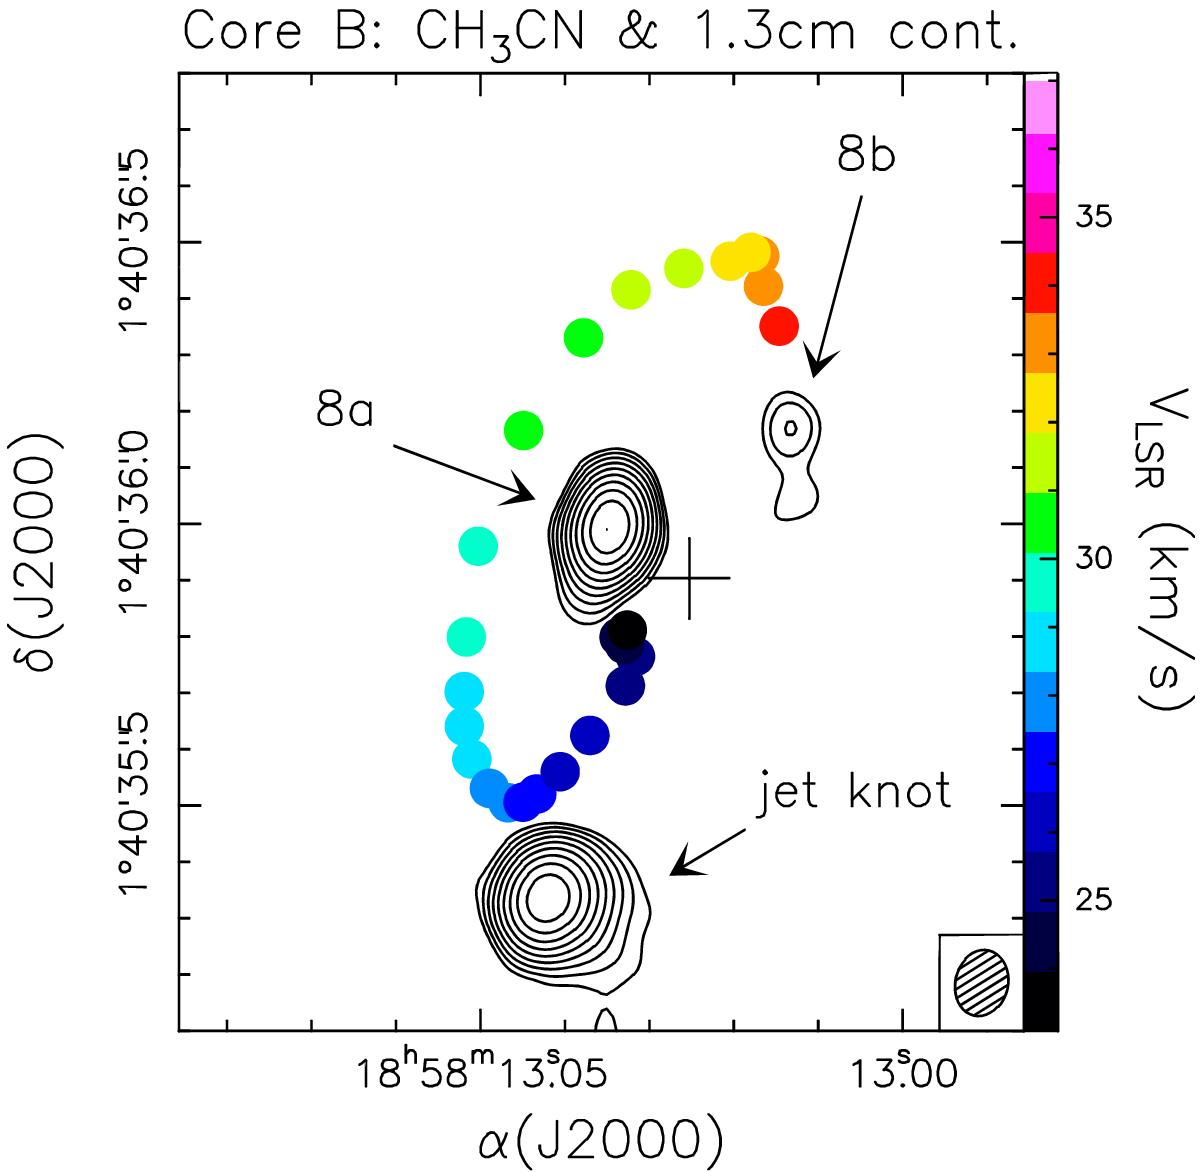
Fig. 7

VLA map of the 1.3 cm continuum emission (contours) towards G35.20N overlaid on the Keplerian disk traced by the peaks of the CH3CN(19–18) K = 2 emission at different velocities (solid circles, color-coded as indicated in the figure), imaged with ALMA (see Sánchez-Monge et al. 2013). The cross marks the position of the sub-mm continuum emission at 350 GHz. Contour levels range in logarithmic steps from 0.06 to 1.452 mJy/beam. The synthesized beam of the VLA is shown at the bottom right.
Current usage metrics show cumulative count of Article Views (full-text article views including HTML views, PDF and ePub downloads, according to the available data) and Abstracts Views on Vision4Press platform.
Data correspond to usage on the plateform after 2015. The current usage metrics is available 48-96 hours after online publication and is updated daily on week days.
Initial download of the metrics may take a while.


