Fig. 4
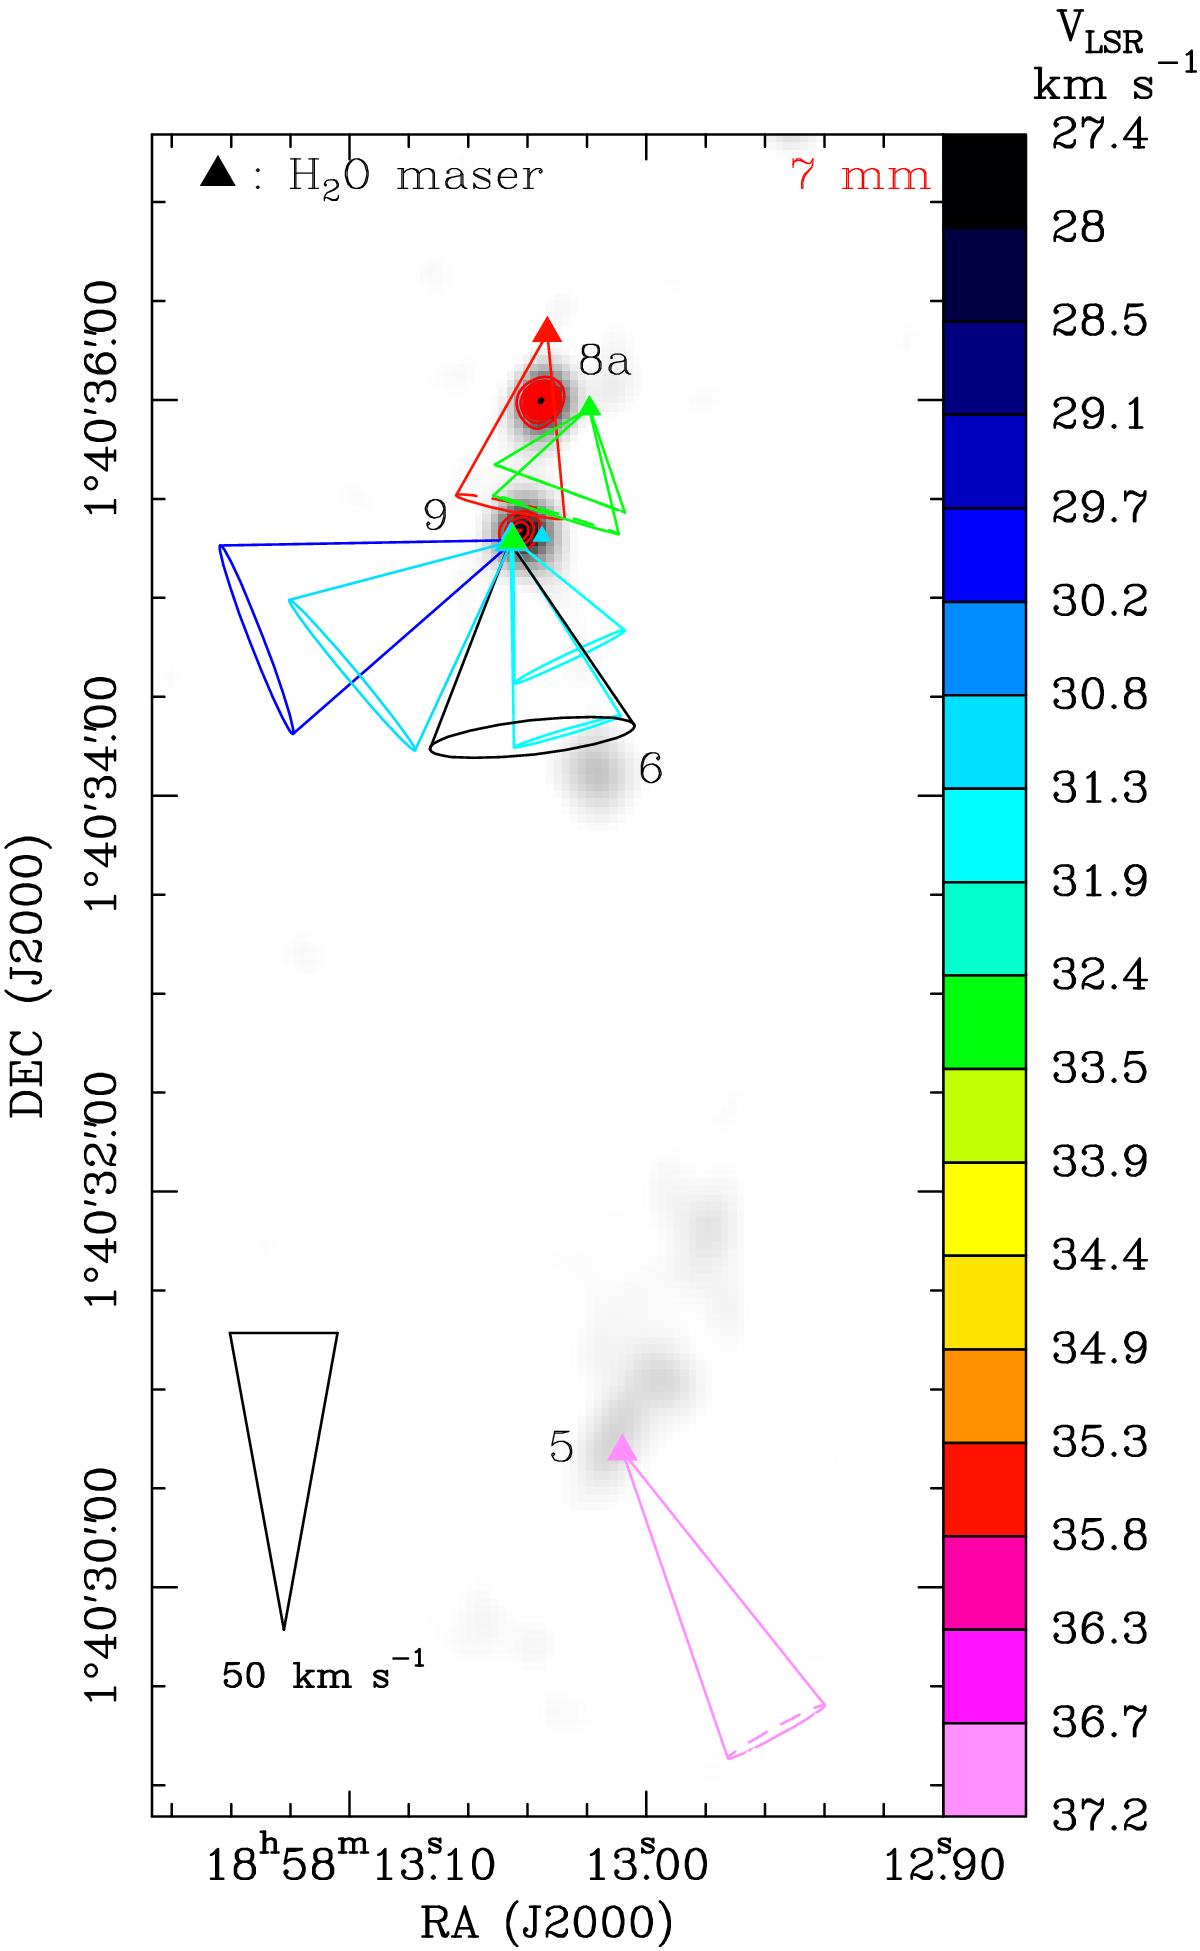
Distribution of water masers (colored triangles) towards G35.20N overlaid with the 1.3 cm (grayscale image) and 7 mm (red contours) VLA continuum observed in the B configuration. Colored triangles show the absolute position of individual maser features, with colors denoting the maser VLSR according to the color-velocity conversion code shown on the right side of the panel. The triangle area is proportional to the logarithm of the maser intensity. Colored cones represent the measured maser proper motions, with cone aperture giving the uncertainty on the direction of the motion. The amplitude scale for the maser velocity is indicated by the black cone at the bottom left of the panel. The grayscale image reproduces linearly the intensity of the VLA B-Array 1.3 cm continuum from 0.05 mJy beam-1 (≈3σ) to 1.7 mJy beam-1. The red contours reproduce the B-Array 7 mm continuum, plotting levels from 10% to 90%, in steps of 10%, of the peak value of 3.5 mJy beam-1. Radio knots are labeled using the same numbers as in Table 2.
Current usage metrics show cumulative count of Article Views (full-text article views including HTML views, PDF and ePub downloads, according to the available data) and Abstracts Views on Vision4Press platform.
Data correspond to usage on the plateform after 2015. The current usage metrics is available 48-96 hours after online publication and is updated daily on week days.
Initial download of the metrics may take a while.