Fig. 3
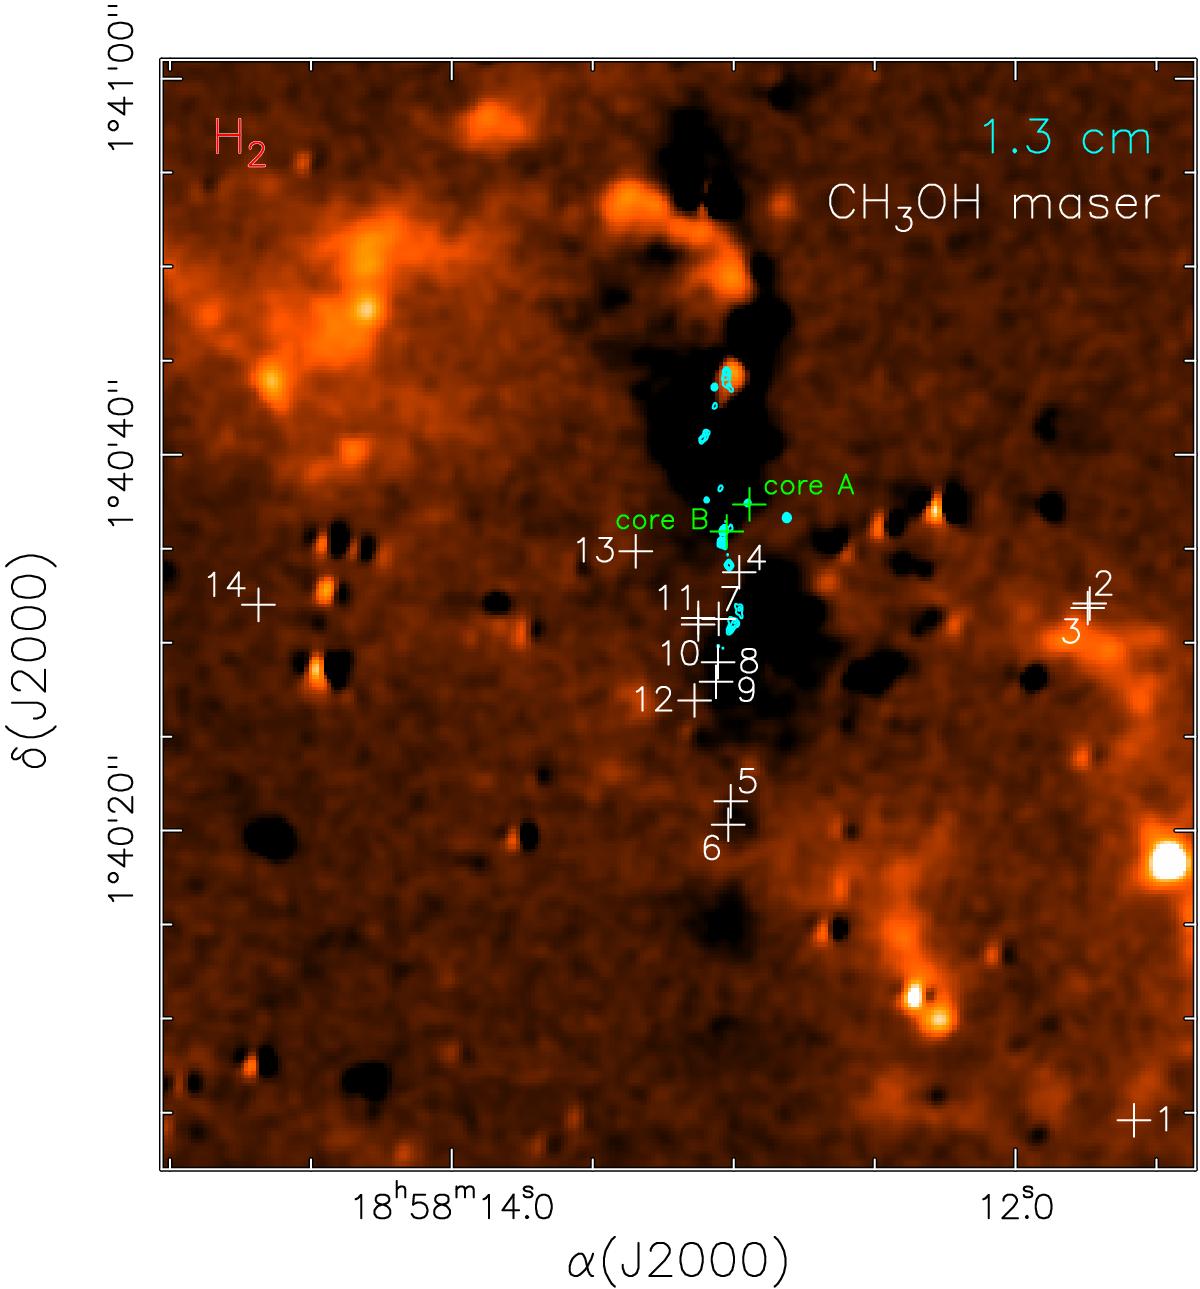
H2 2.12 μm emission towards G35.20N from the UWISH2 survey (Froebrich et al. 2011) overlaid by the 1.3 cm continuum emission (cyan contours) observed in the B configuration. Cyan contours are the same as in Fig. 1. The numbers and white crosses indicate the positions of the Class I 44 GHz CH3OH masers (see Table 4). Green crosses mark the positions of the 870 μm continuum sources core A and B (Sánchez-Monge et al. 2014).
Current usage metrics show cumulative count of Article Views (full-text article views including HTML views, PDF and ePub downloads, according to the available data) and Abstracts Views on Vision4Press platform.
Data correspond to usage on the plateform after 2015. The current usage metrics is available 48-96 hours after online publication and is updated daily on week days.
Initial download of the metrics may take a while.