Fig. 2
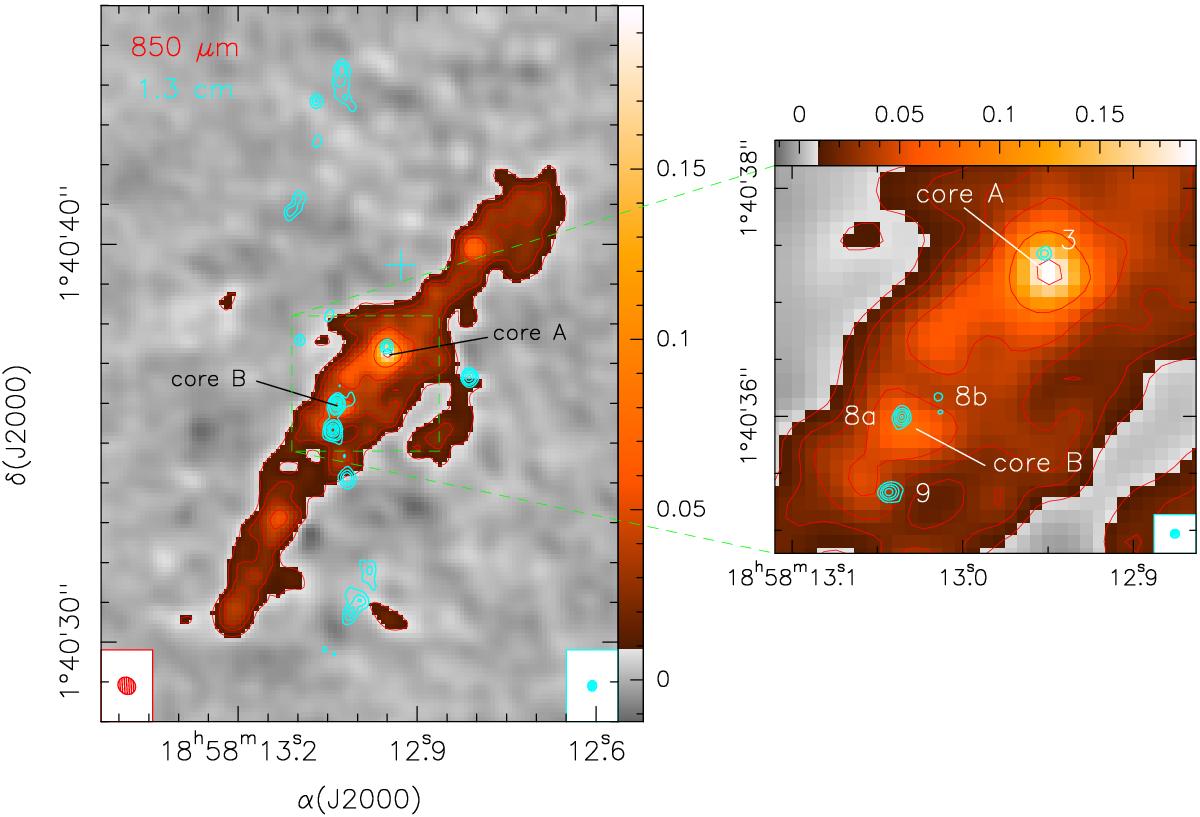
(Left panel) Overlay of the ALMA 870 μm continuum emission (colors and red contours) from Sánchez-Monge et al. (2013) on the VLA 1.3 cm continuum emission (cyan contours) observed in B configuration. The cyan cross indicates the position of source 2, not detected at 1.3 cm, as estimated from the 2 cm map. The ALMA and VLA synthesized beam are shown in the lower left and lower right corner, respectively. Red contours are 5, 10, 15, 25, 50, and 100 times 1σ, which is 1.8 mJy beam-1. Cyan contours are the same as in Fig. 1. (Right panel) Close-up of the central region around cores A and B that shows the ALMA 870 μm continuum emission image overlaid with the VLA 1.3 cm continuum emission (cyan contours) observed in A configuration. Cyan contours are 3, 6, 18, 36, and 54 times 1σ, which is 0.023 mJy beam-1. Red contours are the same as in the left panel. The VLA synthesized beam is shown in the lower right corner. The numbers correspond to the centimeter continuum sources in Table 3.
Current usage metrics show cumulative count of Article Views (full-text article views including HTML views, PDF and ePub downloads, according to the available data) and Abstracts Views on Vision4Press platform.
Data correspond to usage on the plateform after 2015. The current usage metrics is available 48-96 hours after online publication and is updated daily on week days.
Initial download of the metrics may take a while.