Free Access
Fig. 6
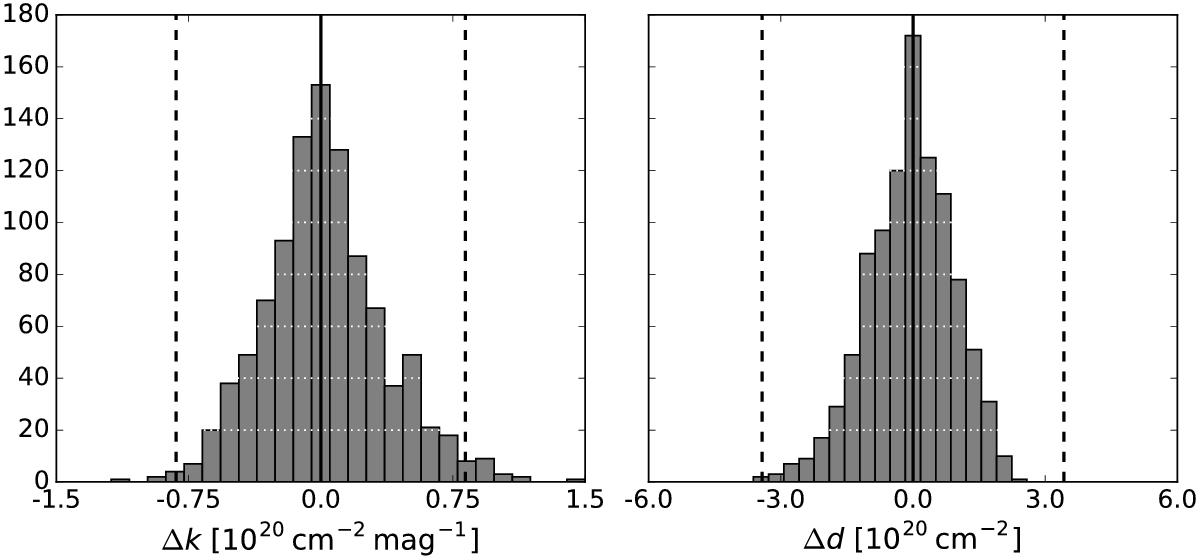
Same as Fig. 5, but for the sample reduced by 10% of the total number of objects in the final sample. There are no simulations for which the refitted parameters assume values beyond the x-axis limits. Dashed lines indicate statistical 1σ uncertainties of the fit to the entire sample.
Current usage metrics show cumulative count of Article Views (full-text article views including HTML views, PDF and ePub downloads, according to the available data) and Abstracts Views on Vision4Press platform.
Data correspond to usage on the plateform after 2015. The current usage metrics is available 48-96 hours after online publication and is updated daily on week days.
Initial download of the metrics may take a while.