Fig. 8
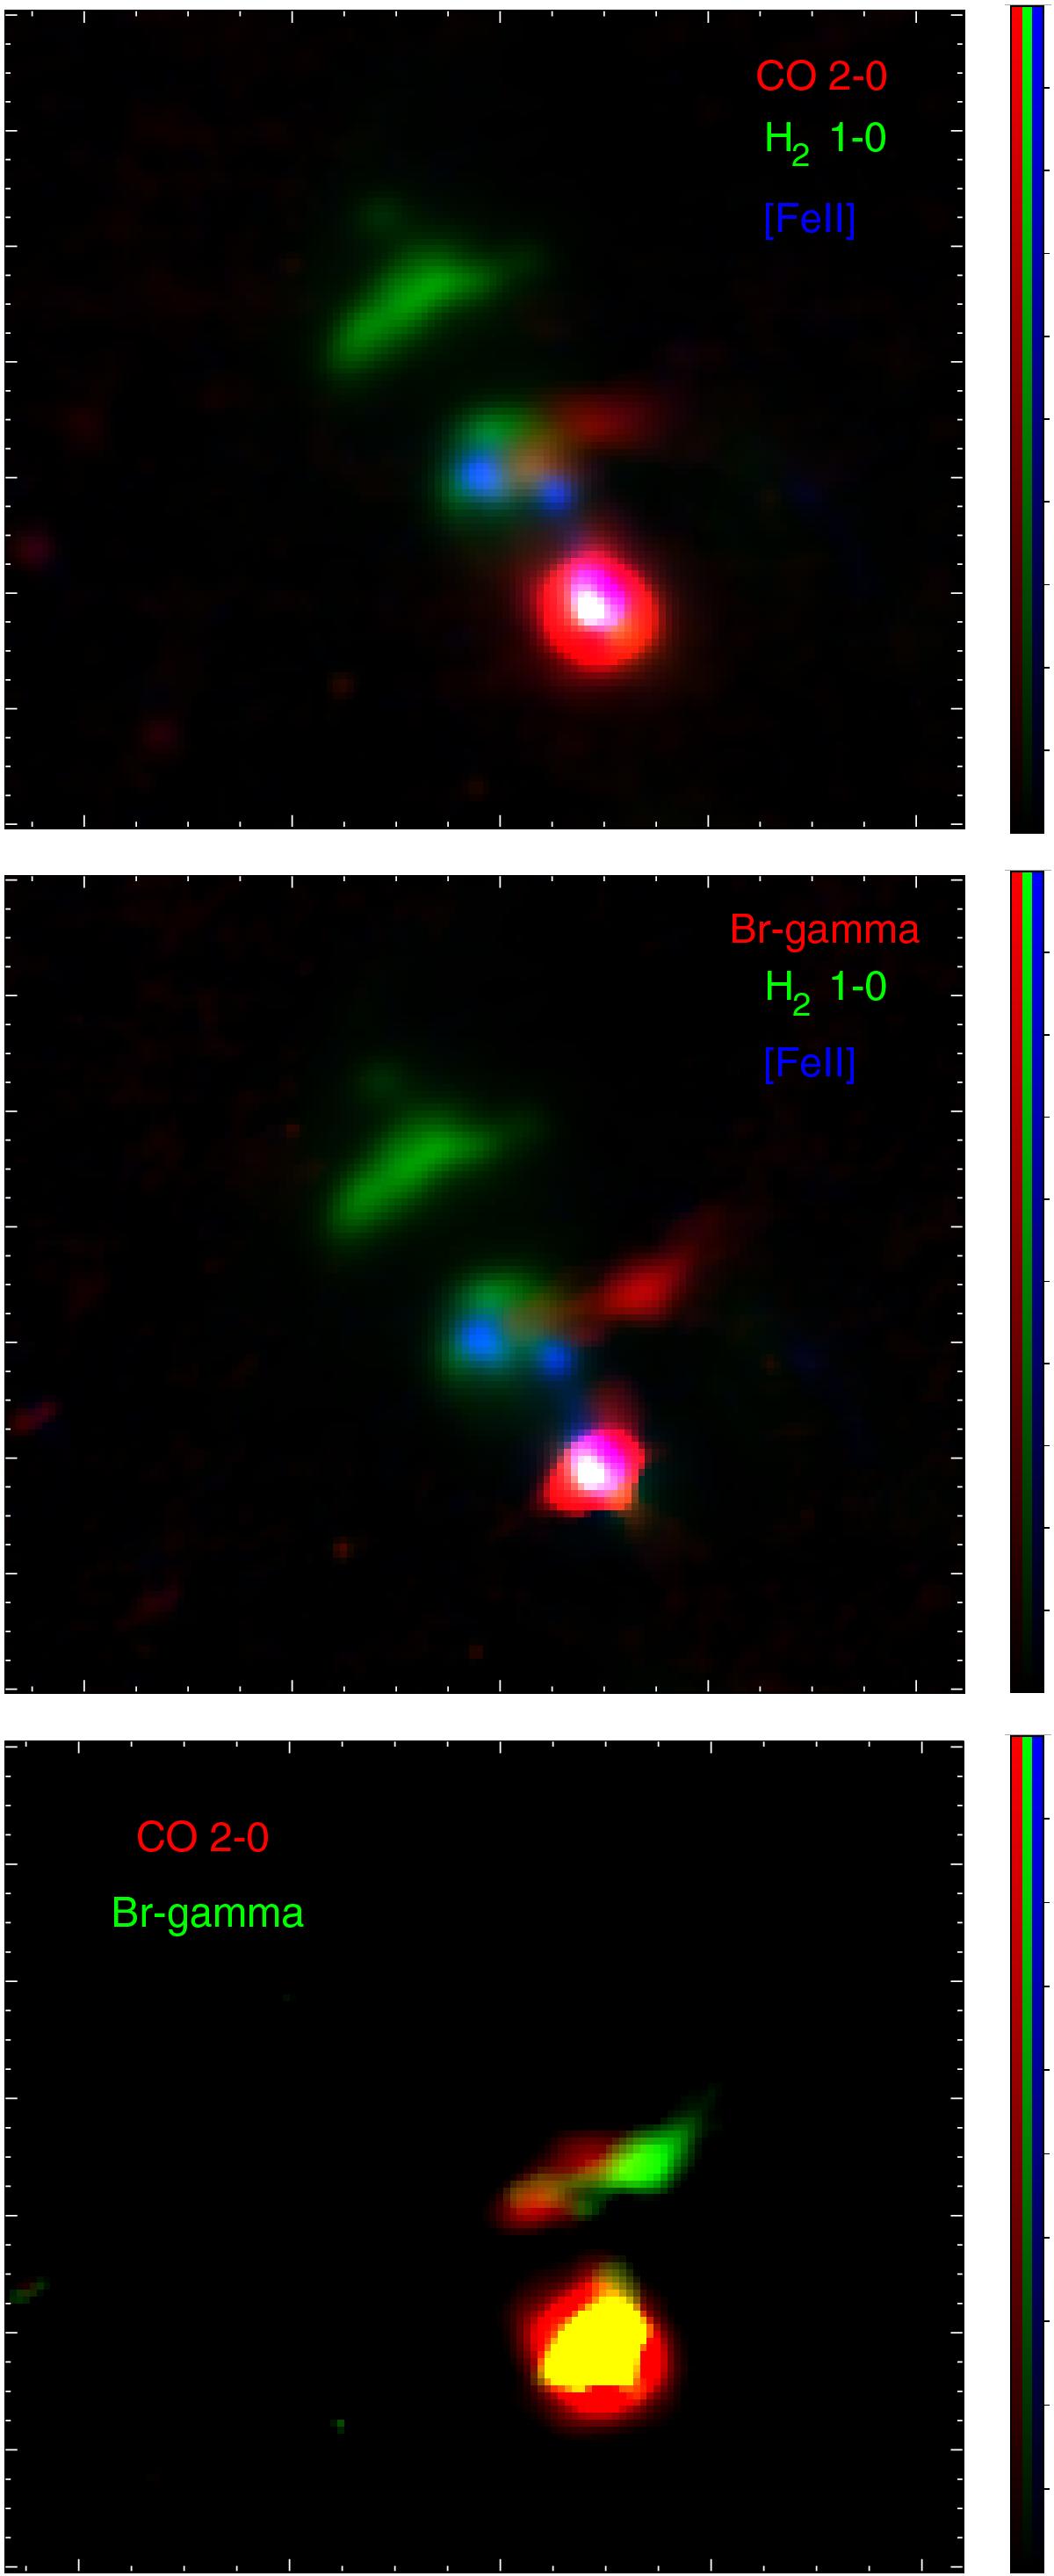
Color images composed with the continuum-subtracted lines indicated in each panel. The black and the respective color in the color bars represents 0% and 100% of emission. The highest values are 8, 50, and 2 ADU for red, green, and blue, respectively, in the top and middle panels, and 5 ADU for red and green in the bottom panel. All images were normalized to 1 s.
Current usage metrics show cumulative count of Article Views (full-text article views including HTML views, PDF and ePub downloads, according to the available data) and Abstracts Views on Vision4Press platform.
Data correspond to usage on the plateform after 2015. The current usage metrics is available 48-96 hours after online publication and is updated daily on week days.
Initial download of the metrics may take a while.