Fig. 7
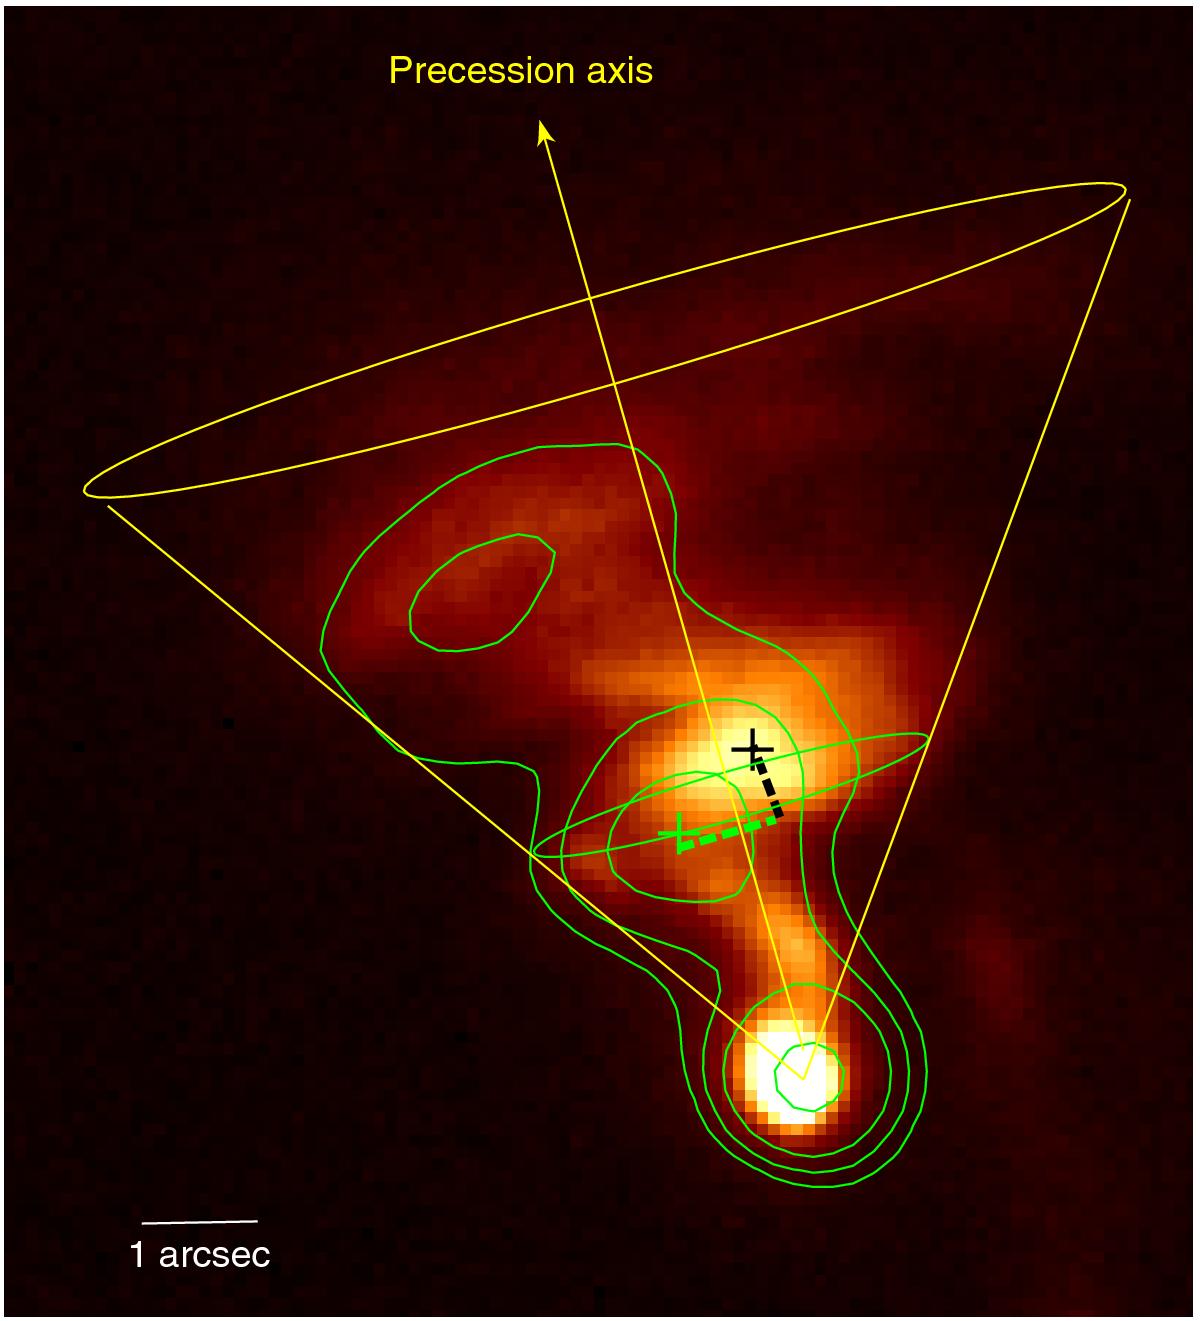
Combination of the J-band emission obtained in two different epochs: the background image is from our observations obtained in 2014, while the green superimposed contours are from the UKIDSS Survey image obtained in 2005. The green and black crosses are the peak positions in 2005 and 2014, respectively, of the same clump-like feature related to the jet.
Current usage metrics show cumulative count of Article Views (full-text article views including HTML views, PDF and ePub downloads, according to the available data) and Abstracts Views on Vision4Press platform.
Data correspond to usage on the plateform after 2015. The current usage metrics is available 48-96 hours after online publication and is updated daily on week days.
Initial download of the metrics may take a while.