Fig. 5
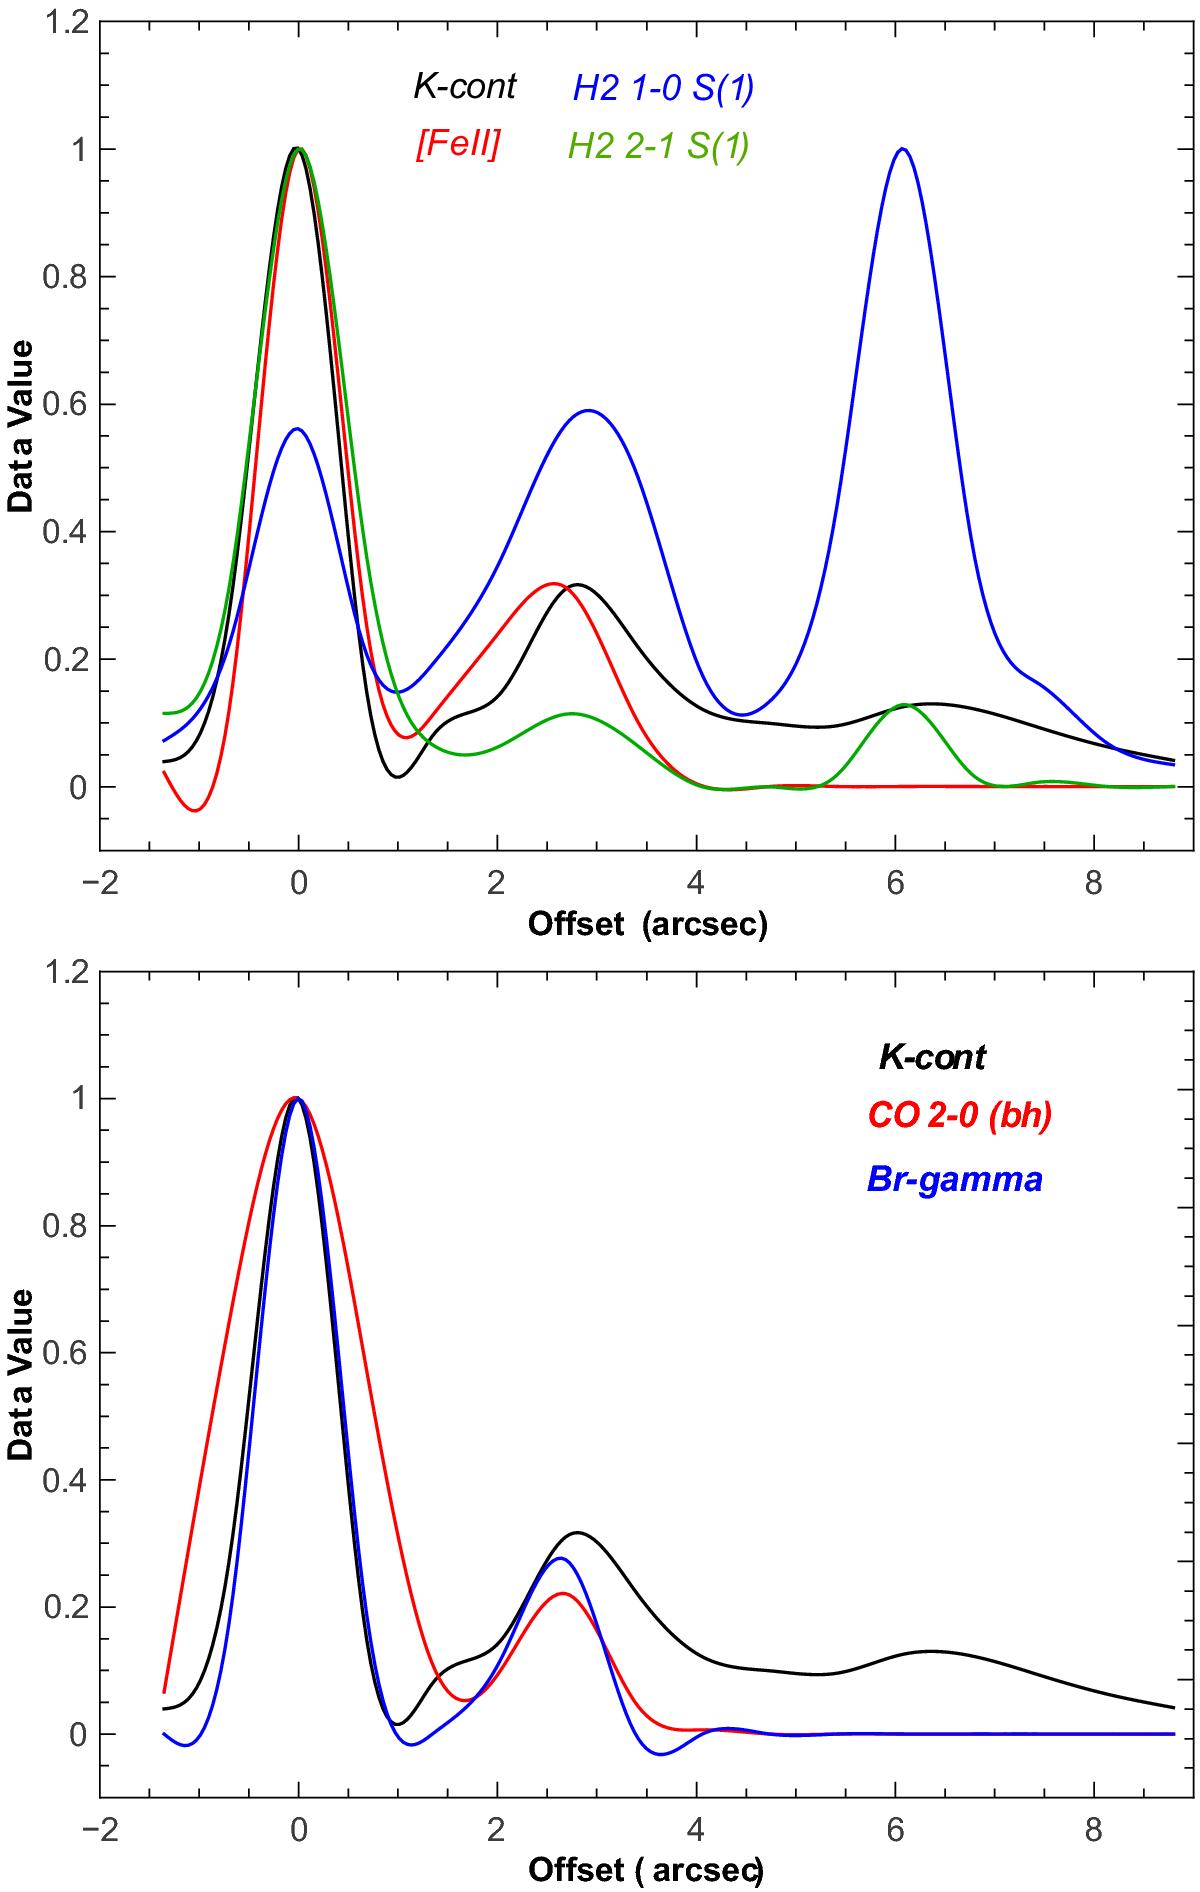
Profiles of the line emission plotted along the axis of the cone-shaped nebula (the offset axis is measured in the plane of the sky). In the top panel we present profiles of [FeII], H2 1−0 S(1), and H2 2−1 S(1) in red, blue, and green, respectively. In the bottom panel we show the profiles of CO 2−0 (bh) and Brγ in red and blue, respectively. In both panels, the continuum emission in K band, observed with the K-cont filter (black), is included for comparison. The profiles are normalized to the peak emission.
Current usage metrics show cumulative count of Article Views (full-text article views including HTML views, PDF and ePub downloads, according to the available data) and Abstracts Views on Vision4Press platform.
Data correspond to usage on the plateform after 2015. The current usage metrics is available 48-96 hours after online publication and is updated daily on week days.
Initial download of the metrics may take a while.