Fig. 4
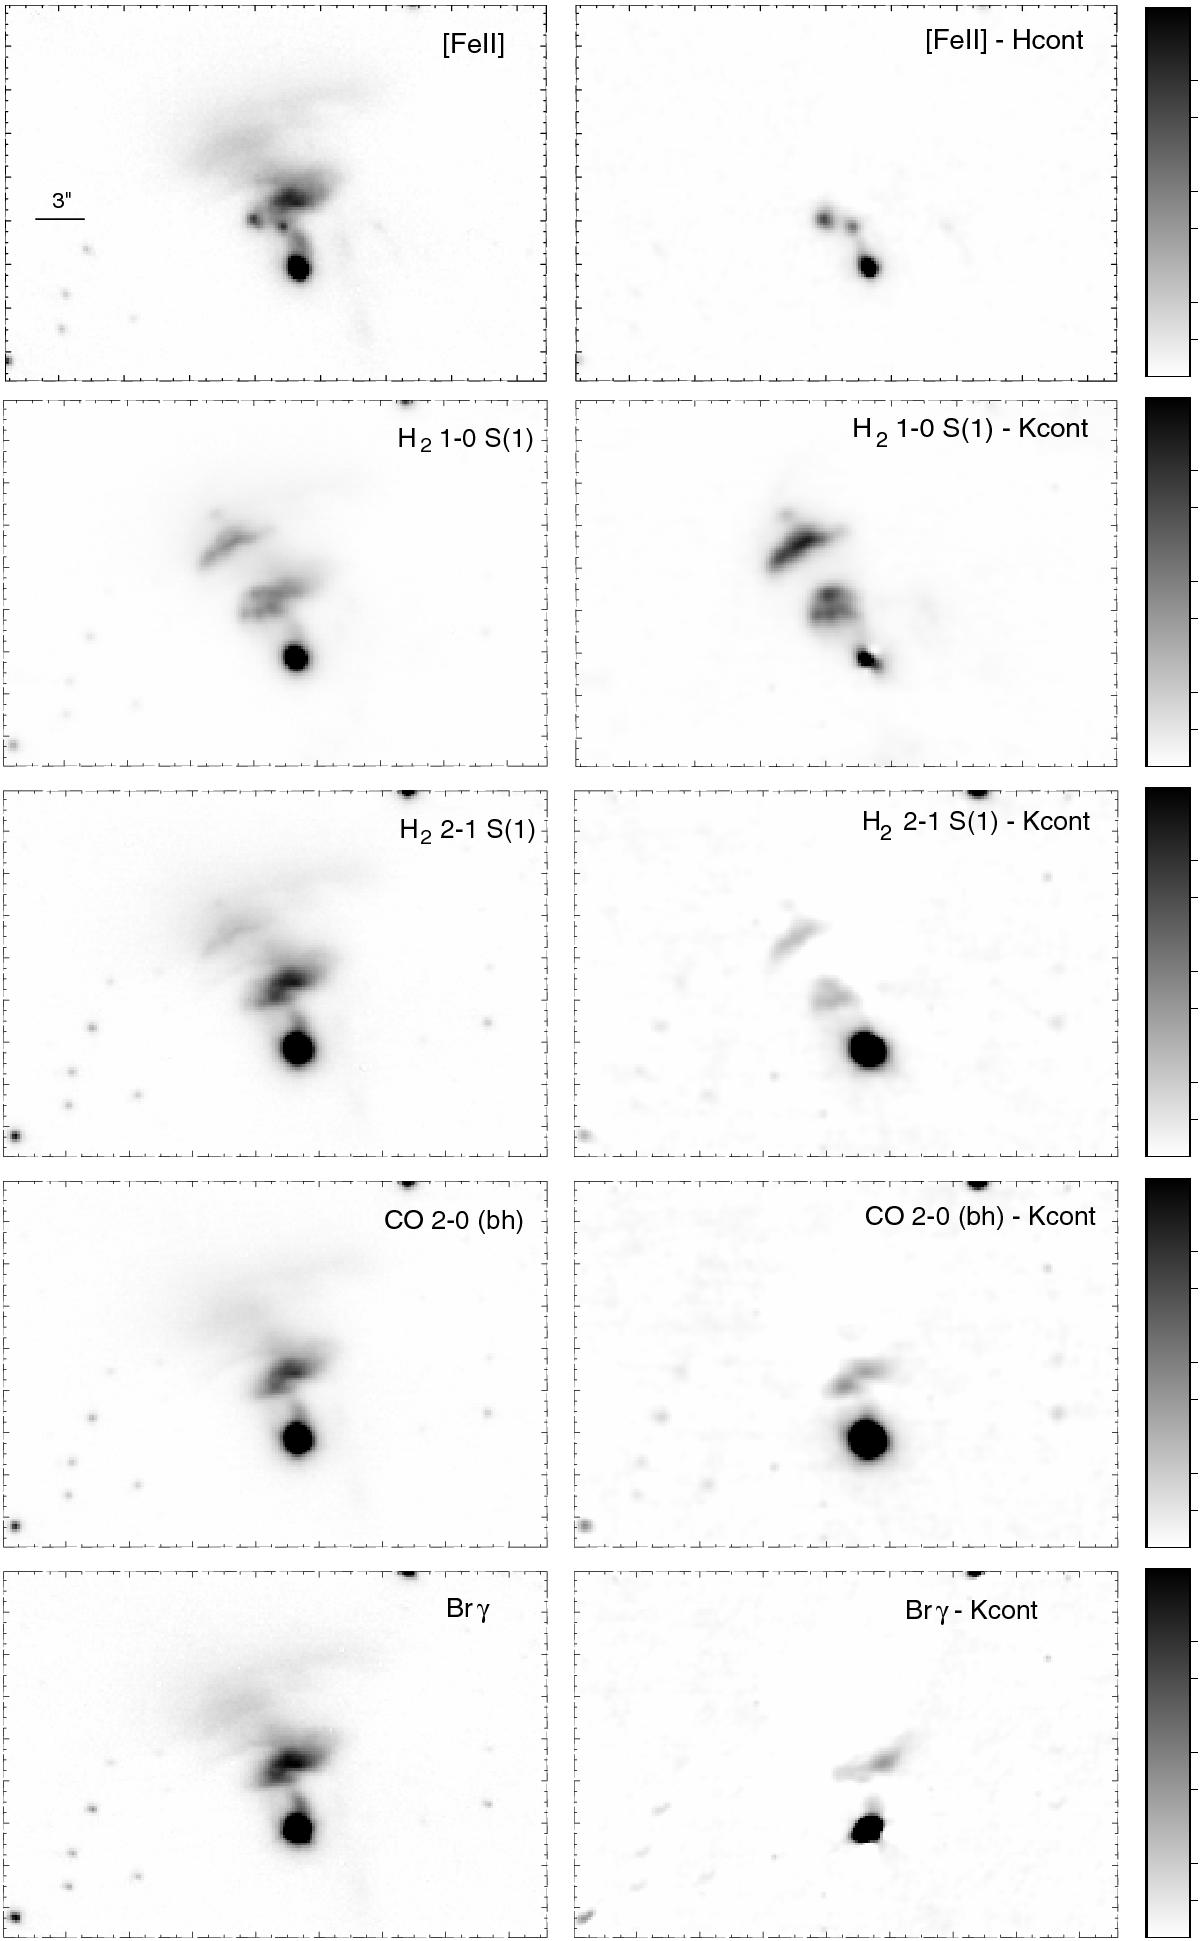
Left panels: narrowband images centered on the indicated lines with continuum. Right panels: narrowband images centered on the indicated lines where the corresponding continuum was subtracted. The object nebular emission in all the subtracted images is above 5σ over the background. White and black in the color bars represent 0% and 100% of the emission. The highest values are (from top to bottom panel) 3, 35, 10, 15, and 10 ADU. All images were normalized to 1 s.
Current usage metrics show cumulative count of Article Views (full-text article views including HTML views, PDF and ePub downloads, according to the available data) and Abstracts Views on Vision4Press platform.
Data correspond to usage on the plateform after 2015. The current usage metrics is available 48-96 hours after online publication and is updated daily on week days.
Initial download of the metrics may take a while.