Fig. 2
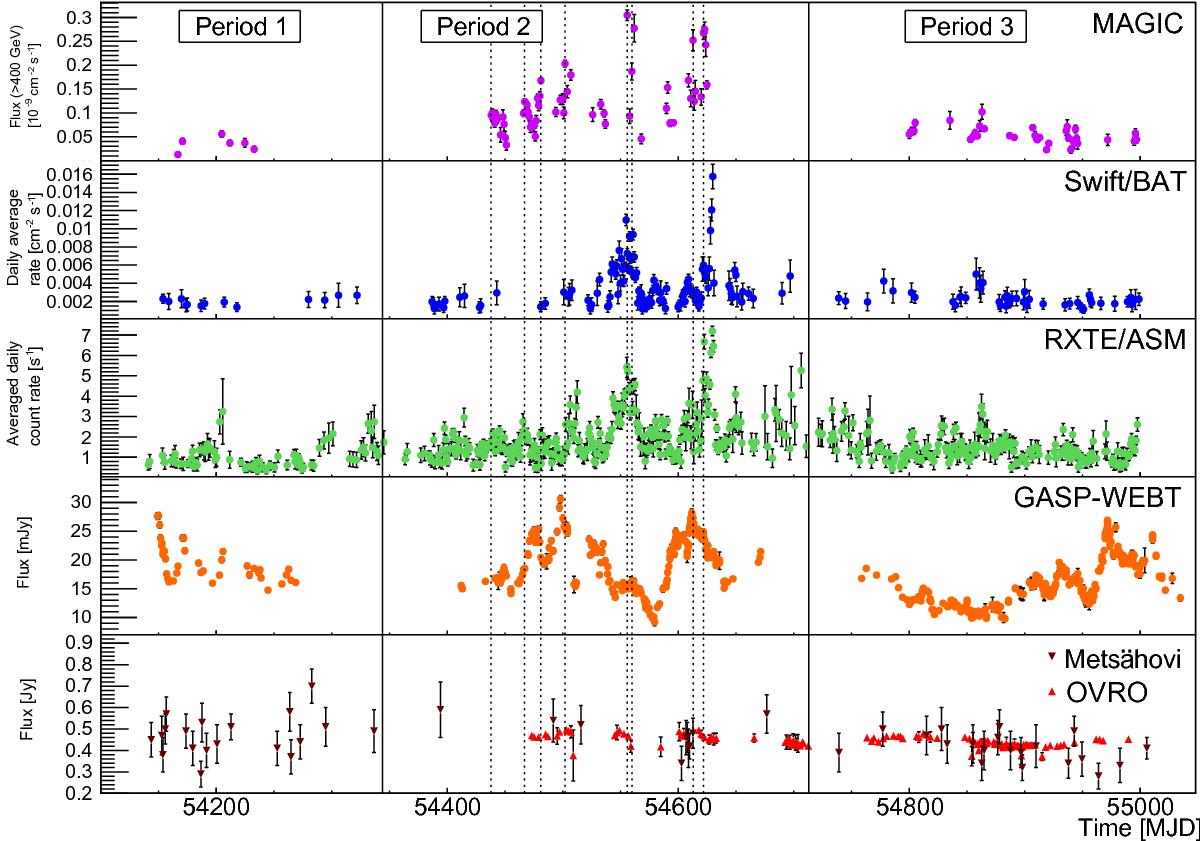
Light curves of MAGIC, Swift/BAT, RXTE/ASM, GASP-WEBT, Metsähovi and OVRO from top to bottom in the time range from February 2007 to July 2009. The vertical dotted black lines denote the position of the TeV γ-ray flares as identified with the Bayesian Block algorithm (see Sect. 3). The vertical black lines mark the division between the three time periods (Period 1, Period 2, Period 3).
Current usage metrics show cumulative count of Article Views (full-text article views including HTML views, PDF and ePub downloads, according to the available data) and Abstracts Views on Vision4Press platform.
Data correspond to usage on the plateform after 2015. The current usage metrics is available 48-96 hours after online publication and is updated daily on week days.
Initial download of the metrics may take a while.