Free Access
Fig. 5
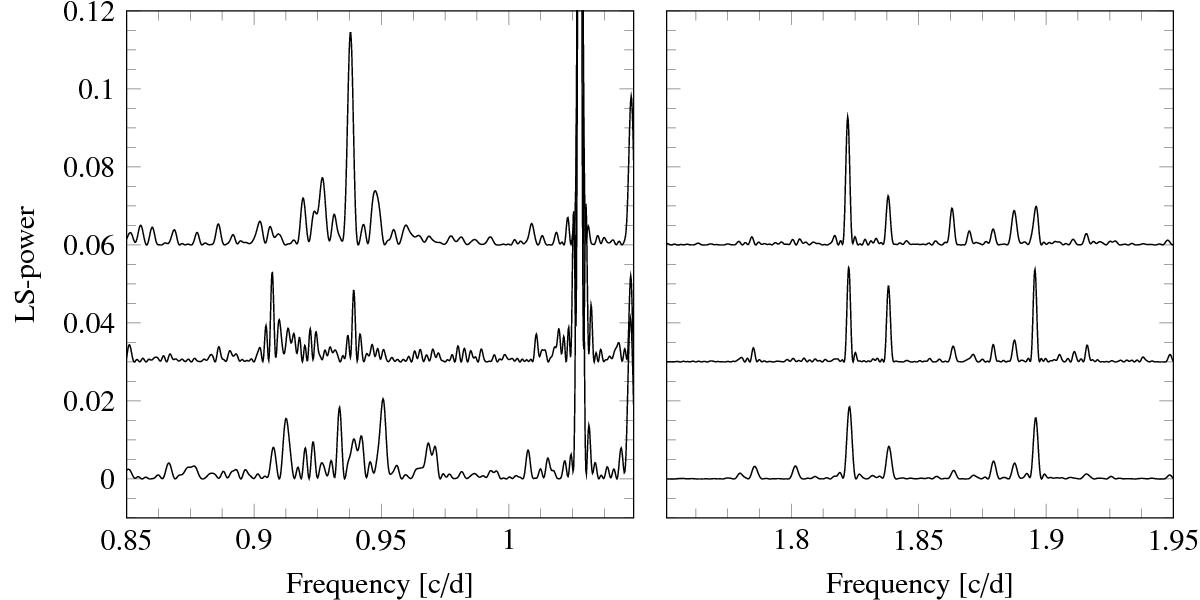
LS power spectra of the data divided into three sub-runs; from top to bottom the independent analysis for quarters 12–17, 6–11, and 0–5 is shown. Left: StHα166 in the region of the Štefl frequencies g1 around 0.95 /¸d; some part of g2 is seen above 1 c/d. Right: the same for for HD 186567 in the region of g2.
Current usage metrics show cumulative count of Article Views (full-text article views including HTML views, PDF and ePub downloads, according to the available data) and Abstracts Views on Vision4Press platform.
Data correspond to usage on the plateform after 2015. The current usage metrics is available 48-96 hours after online publication and is updated daily on week days.
Initial download of the metrics may take a while.