Fig. 4
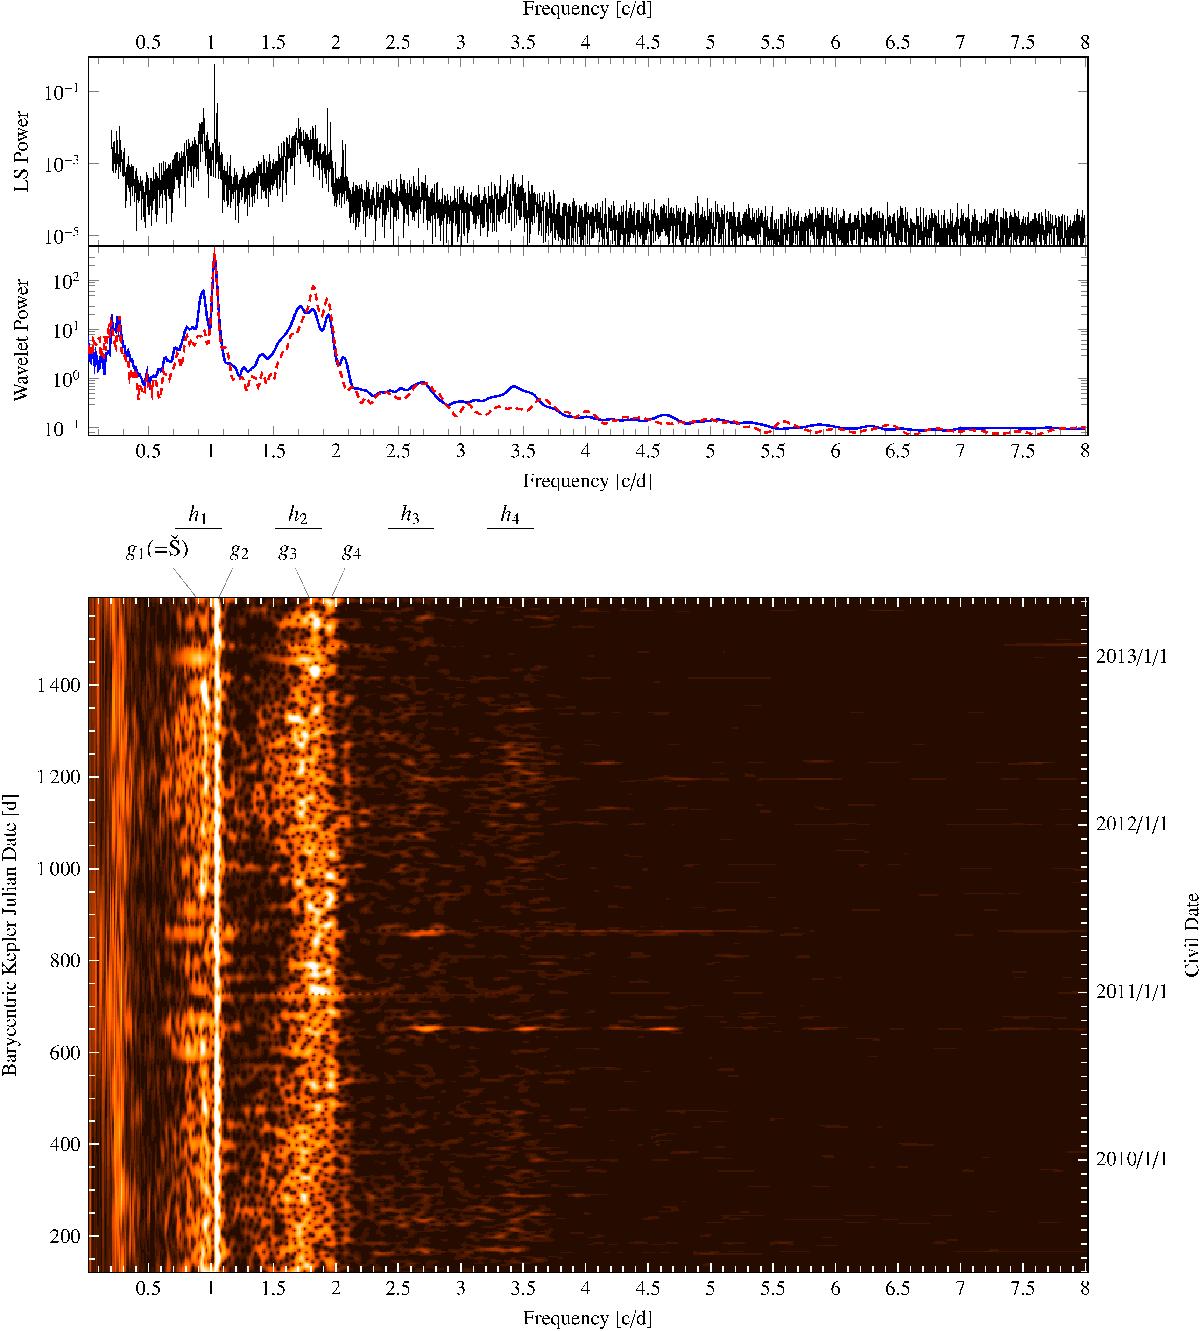
Like Fig. 2, but for StHα166. In the middle panel, instead of the overall wavelet power spectrum, the average power spectrum during more variable phases (t< 700 and 900 <t< 1500) is shown in as a solid line, during less variable (700 <t< 900 and t> 1500) as a dashed one. The label Š denotes the circumstellar Štefl frequencies (see Sect. 4.2).
Current usage metrics show cumulative count of Article Views (full-text article views including HTML views, PDF and ePub downloads, according to the available data) and Abstracts Views on Vision4Press platform.
Data correspond to usage on the plateform after 2015. The current usage metrics is available 48-96 hours after online publication and is updated daily on week days.
Initial download of the metrics may take a while.