Fig. 3
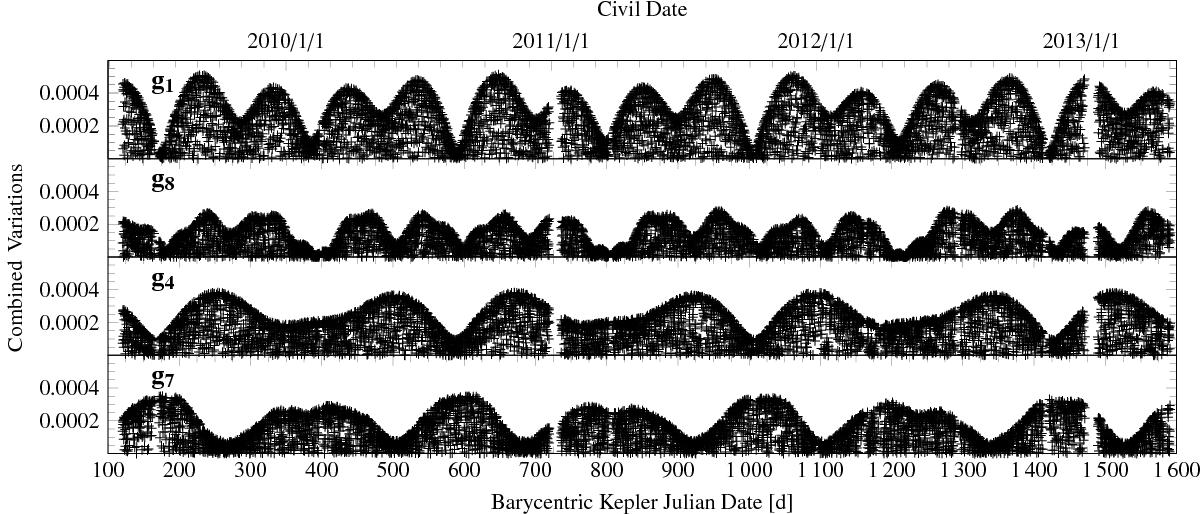
Amplitude variation with time for g1, g8, g4 and g7 (top to bottom) of ALS 10705. The individual points were computed by co-adding the fits to all frequencies found by LS belonging to each group, and then the absolute value was plotted. The upper envelope of each group, therefore, represents the amplitude variations seen in the lower panel of Fig. 2 and illustrates the various correlations described in the text.
Current usage metrics show cumulative count of Article Views (full-text article views including HTML views, PDF and ePub downloads, according to the available data) and Abstracts Views on Vision4Press platform.
Data correspond to usage on the plateform after 2015. The current usage metrics is available 48-96 hours after online publication and is updated daily on week days.
Initial download of the metrics may take a while.