Fig. 2
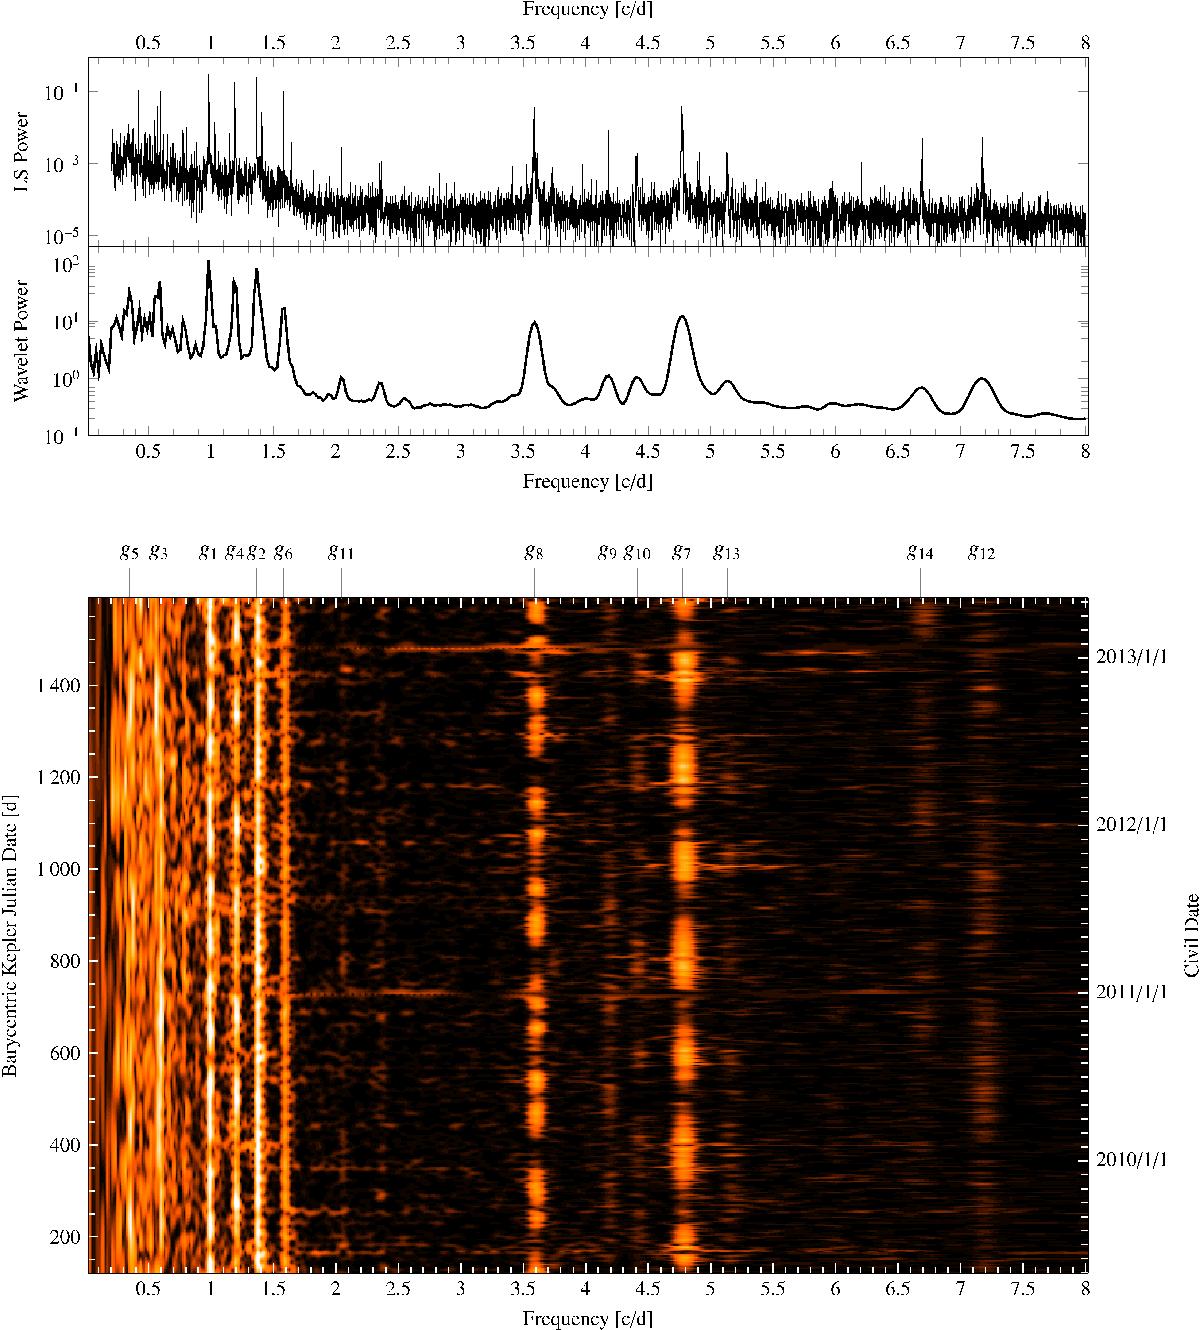
Time series analysis of ALS 10705. From top to bottom the LS periodogram, the time averaged result of the wavelet analysis, both shown in logarithmic scale, and the full 2D result of the wavelet analysis, where the intensity is displayed in logarithmic scale, too. The frequency groups discussed in the text are identified above the lowermost panel.
Current usage metrics show cumulative count of Article Views (full-text article views including HTML views, PDF and ePub downloads, according to the available data) and Abstracts Views on Vision4Press platform.
Data correspond to usage on the plateform after 2015. The current usage metrics is available 48-96 hours after online publication and is updated daily on week days.
Initial download of the metrics may take a while.