Fig. 8
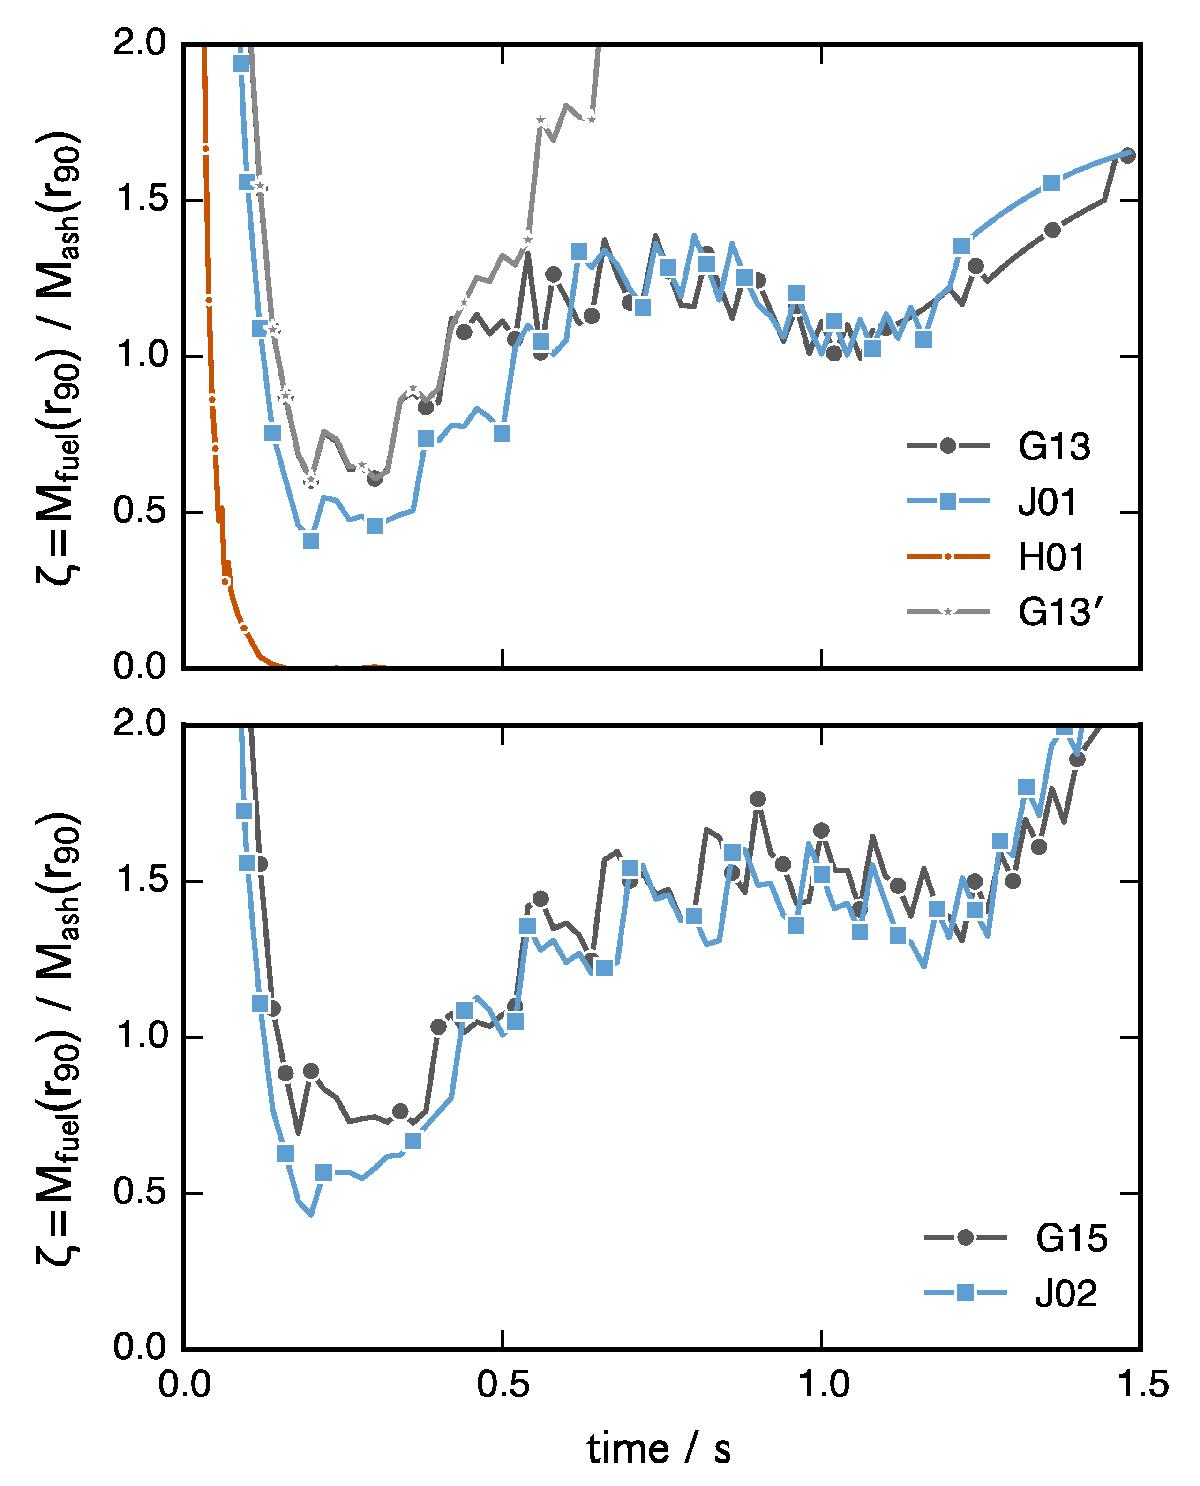
Time evolution of the flame asymmetry diagnostic parameter ζ for 2563 simulations from the G, J and H simulation series (see Table 1). The bottom panel shows the simulations with EoS Coulomb corrections, and the top panel shows the simulations without. The asymmetry develops in much the same way regardless of the inclusion of Coulomb corrections in the EoS, and is even slightly more pronounced when they are included. Clearly, the Rayleigh-Taylor instability is suppressed in the highest density simulation (H01) and the flame surface becomes essentially a sphere (ζ = 0). Figure 7 shows the severity of the asymmetry for different values of ζ, which is difficult to imagine a priori.
Current usage metrics show cumulative count of Article Views (full-text article views including HTML views, PDF and ePub downloads, according to the available data) and Abstracts Views on Vision4Press platform.
Data correspond to usage on the plateform after 2015. The current usage metrics is available 48-96 hours after online publication and is updated daily on week days.
Initial download of the metrics may take a while.