Fig. 7
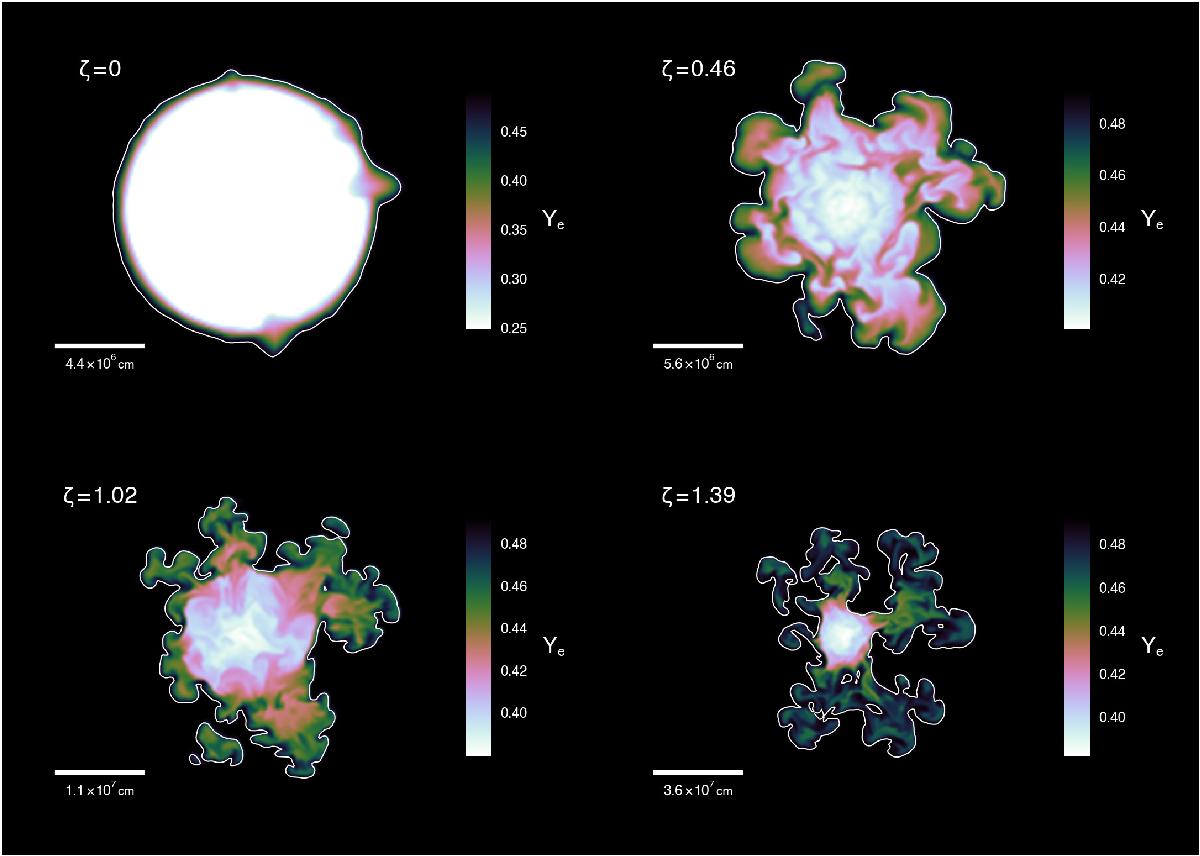
Geometry of the flame surface for different values of the asymmetry diagnostic parameter ζ (1). The plot for ζ = 0 is a snapshot of the H01 simulation at 320 ms of simulated time; the flame surface is essentially a sphere due to the suppression of the Rayleigh-Taylor instability. All of the other plots are of the J01 simulation. The time evolution of ζ is shown in Fig. 8; the asphericity becomes more pronounced with time in the G and J series simulations. Each panel also has a pseudo-colour plot of the electron fraction Ye.
Current usage metrics show cumulative count of Article Views (full-text article views including HTML views, PDF and ePub downloads, according to the available data) and Abstracts Views on Vision4Press platform.
Data correspond to usage on the plateform after 2015. The current usage metrics is available 48-96 hours after online publication and is updated daily on week days.
Initial download of the metrics may take a while.