Fig. 4
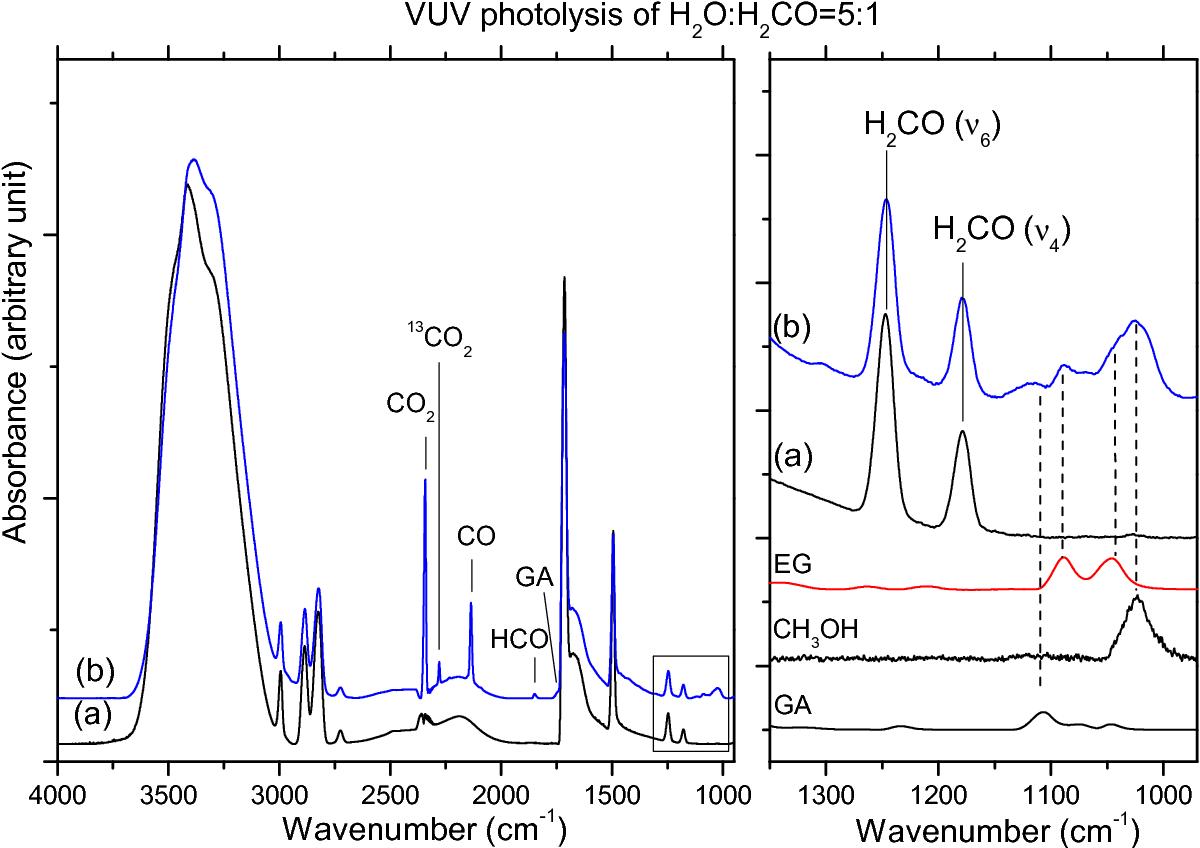
Left panel: infrared spectra of H2CO in water-dominated ice deposited at 13 K (a) and after 23 h of VUV photolysis (b) at 13 K. Right panel: the ν(C−O) stretching region has been enlarged for clarity. The infrared spectra recorded before and after photolysis at 13 K of H2CO in water-dominated ice are compared with reference spectra recorded at 13 K of pure ethylene glycol (EG), methanol, and glycolaldehyde (GA).
Current usage metrics show cumulative count of Article Views (full-text article views including HTML views, PDF and ePub downloads, according to the available data) and Abstracts Views on Vision4Press platform.
Data correspond to usage on the plateform after 2015. The current usage metrics is available 48-96 hours after online publication and is updated daily on week days.
Initial download of the metrics may take a while.