Fig. 2
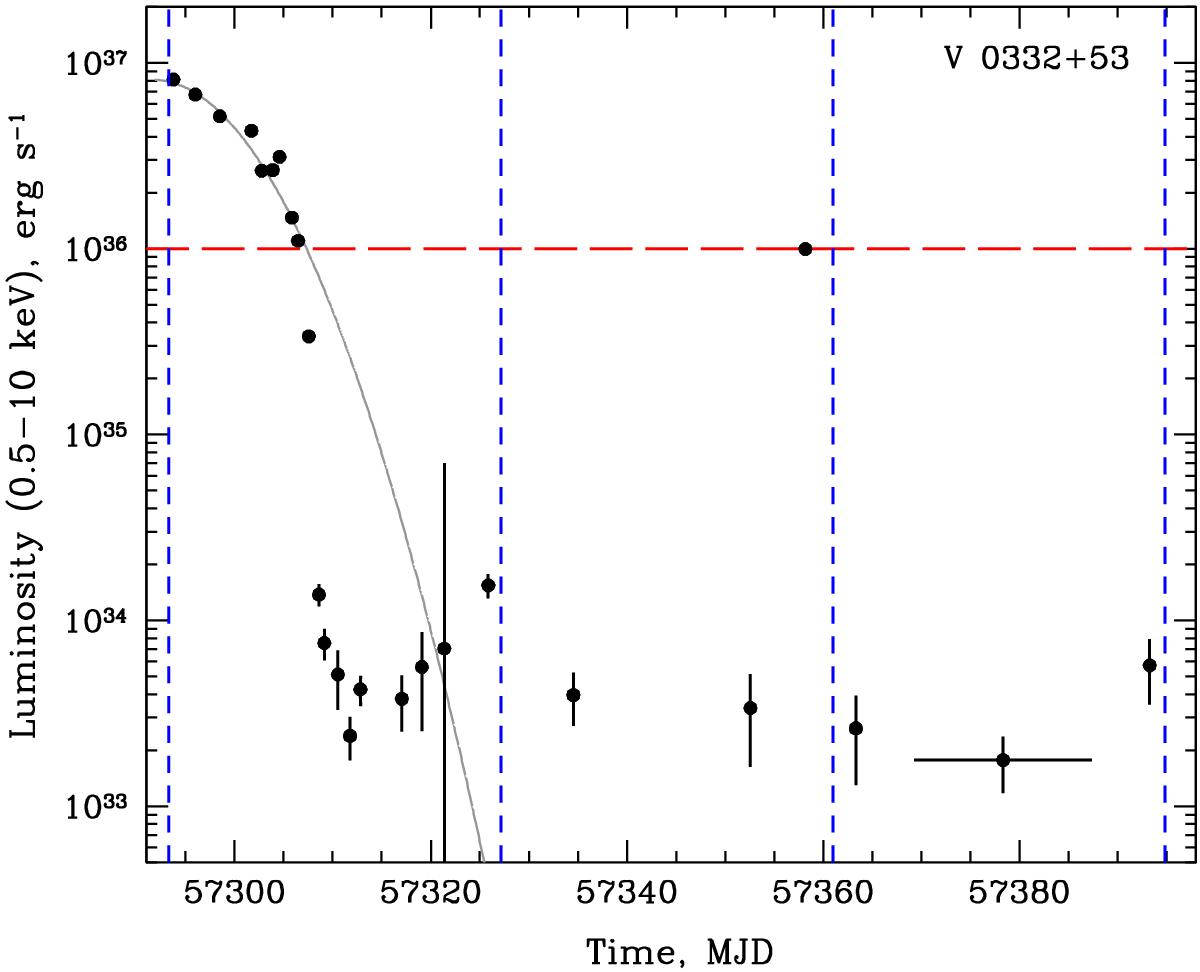
Light curve of V 0332+53 obtained with the Swift/XRT telescope in the 0.5−10 keV energy range. Luminosity is calculated from the unabsorbed flux under assumption of the distance d = 7 kpc. Point near the MJD 57 380 was obtained from averaging of five observations with very low counting statistics. Solid grey line shows the best fit of the light curve before the transition to the propeller regime with a Gaussian function. Horizontal dashed line represents the limiting luminosity when the propeller regime sets in. Positions of vertical dashed lines correspond to the times of the periastron passage (Doroshenko et al. 2016). Applying the bolometric correction to the observed flux effectively increases the luminosity jump by factor of 2 (see Sect. 4.1).
Current usage metrics show cumulative count of Article Views (full-text article views including HTML views, PDF and ePub downloads, according to the available data) and Abstracts Views on Vision4Press platform.
Data correspond to usage on the plateform after 2015. The current usage metrics is available 48-96 hours after online publication and is updated daily on week days.
Initial download of the metrics may take a while.