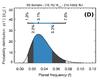
Fig. 3
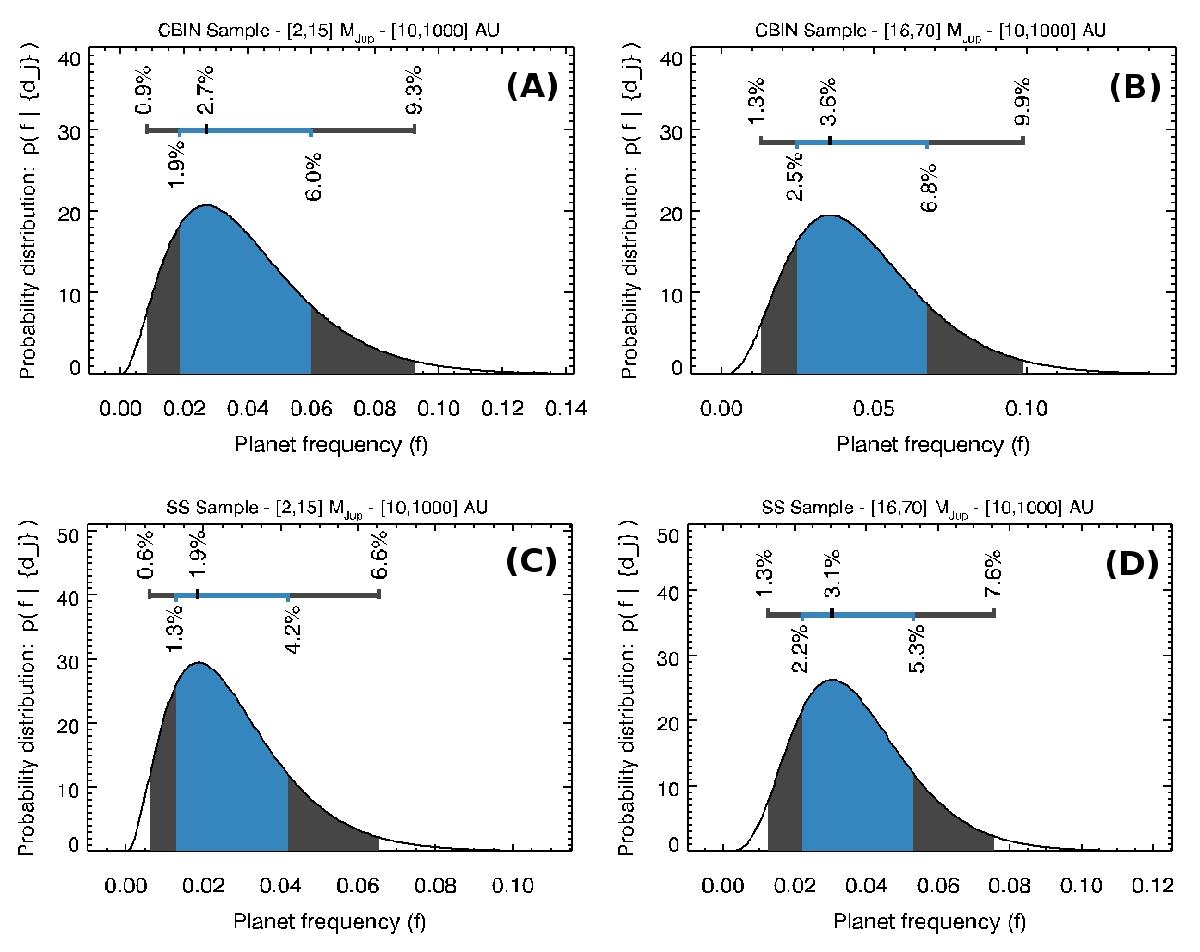
Probability distribution (see Table 4 for details) of the frequency of planetary mass (up to 15 MJup, left panels) and BD (16−70 MJup, right panels). The results for the CBIN sample and the and the SS control sample are shown in the upper and lower panels, respectively. The shaded areas show the frequency limits for the 95% (gray) and 68% (blue) confidence levels.
Current usage metrics show cumulative count of Article Views (full-text article views including HTML views, PDF and ePub downloads, according to the available data) and Abstracts Views on Vision4Press platform.
Data correspond to usage on the plateform after 2015. The current usage metrics is available 48-96 hours after online publication and is updated daily on week days.
Initial download of the metrics may take a while.