Fig. 4
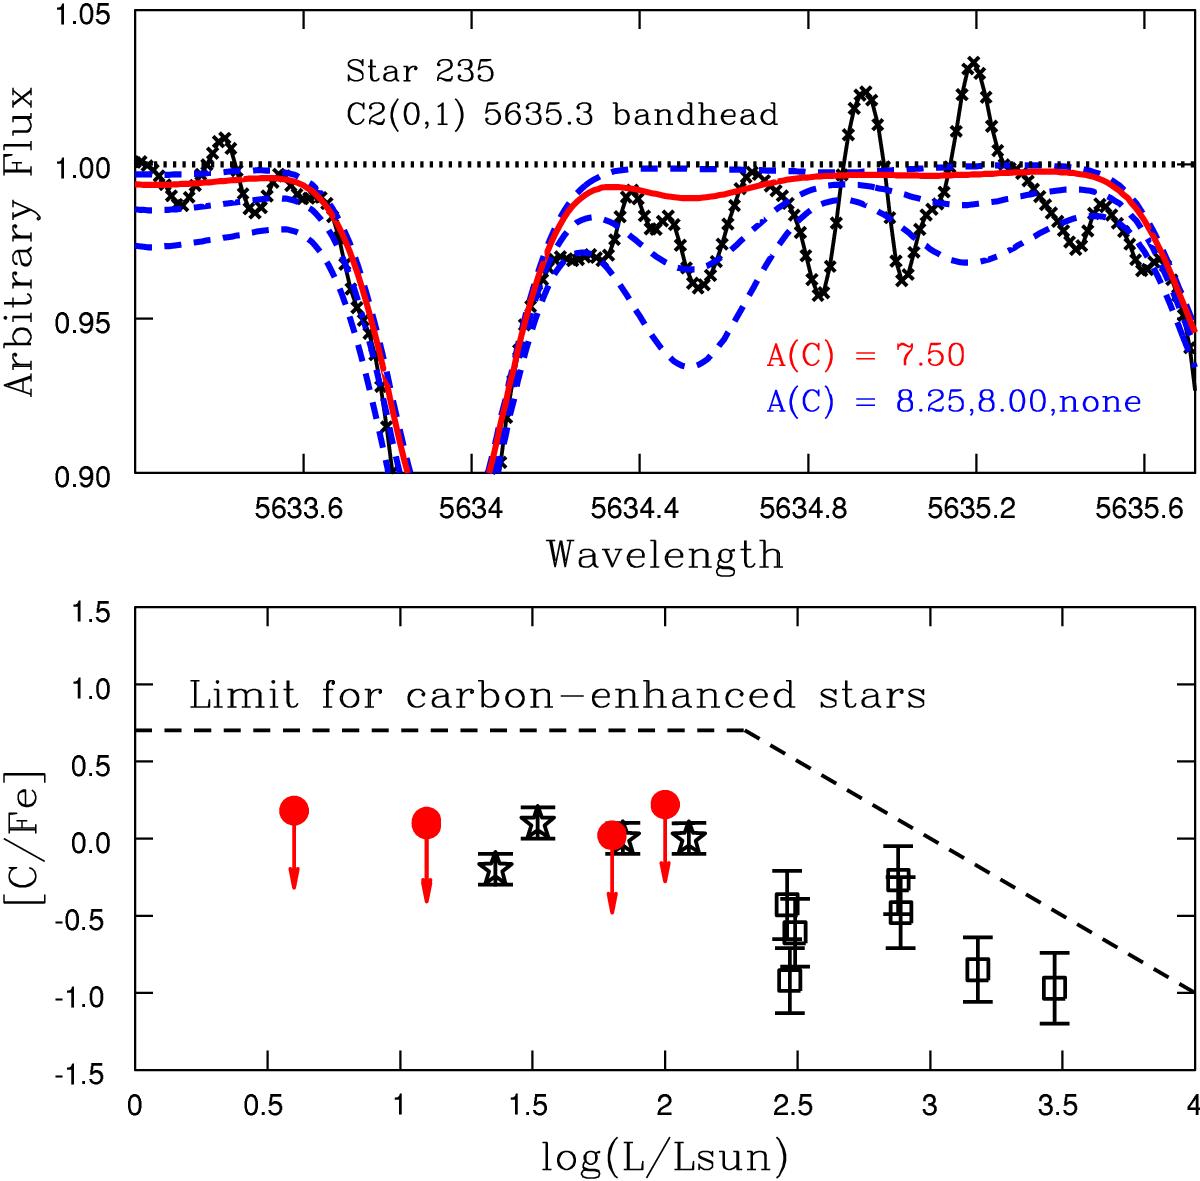
Upper panel: fit to the C2(1,0) bandhead at 5635.3 Å in star 235. Observations (black crosses) are compared with synthetic spectra computed with the different abundances indicated in the figure (blue dashed lines), as well as with the adopted abundance (red solid lines), also indicated. Lower panel: comparison of the [C/Fe] abundance ratios derived in the present sample (filled red circles) with stars from the bulge globular clusters M 62 (Yong et al. 2014, open black squares) and NGC 6522 (Barbuy et al. 2014, open black stars). The dashed black line corresponds to the limit for carbon-enhanced stars, as defined by Aoki et al. (2007).
Current usage metrics show cumulative count of Article Views (full-text article views including HTML views, PDF and ePub downloads, according to the available data) and Abstracts Views on Vision4Press platform.
Data correspond to usage on the plateform after 2015. The current usage metrics is available 48-96 hours after online publication and is updated daily on week days.
Initial download of the metrics may take a while.