Fig. 3
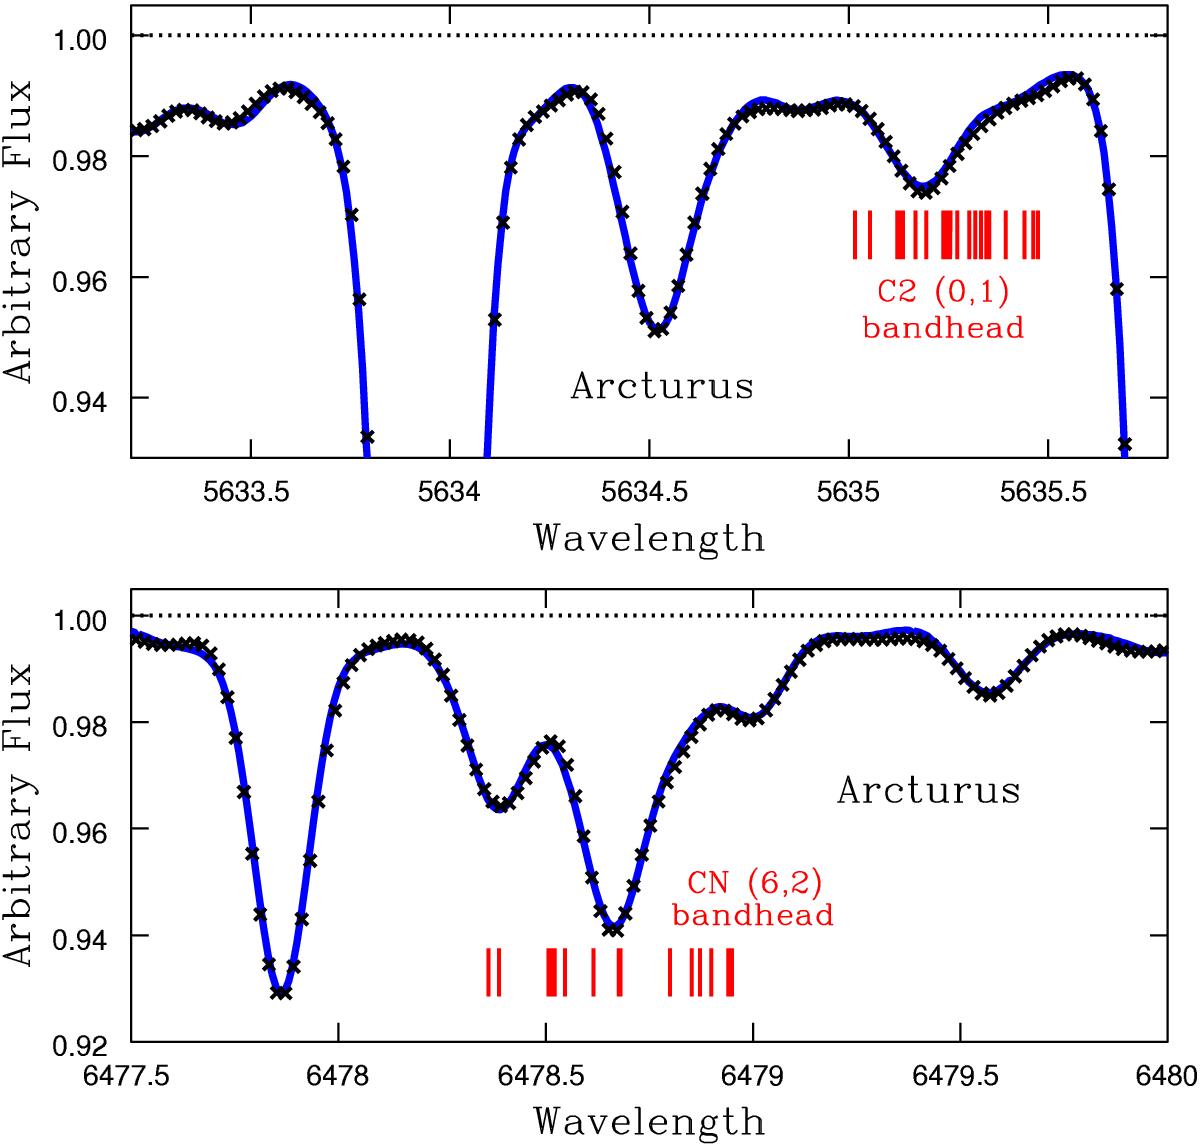
Upper panel: fit to the C2(1,0) molecular bandhead at 5635.3 Å in Arcturus. Observations (black crosses) are compared with synthetic spectra computed with the adopted abundances (blue solid lines) from literature. Red marks show the positions of molecular lines. Lower panel: fit to the CN(6,2) molecular bandhead at 6478.5 Å in Arcturus. Symbols are the same as in the upper panel.
Current usage metrics show cumulative count of Article Views (full-text article views including HTML views, PDF and ePub downloads, according to the available data) and Abstracts Views on Vision4Press platform.
Data correspond to usage on the plateform after 2015. The current usage metrics is available 48-96 hours after online publication and is updated daily on week days.
Initial download of the metrics may take a while.