Fig. 2
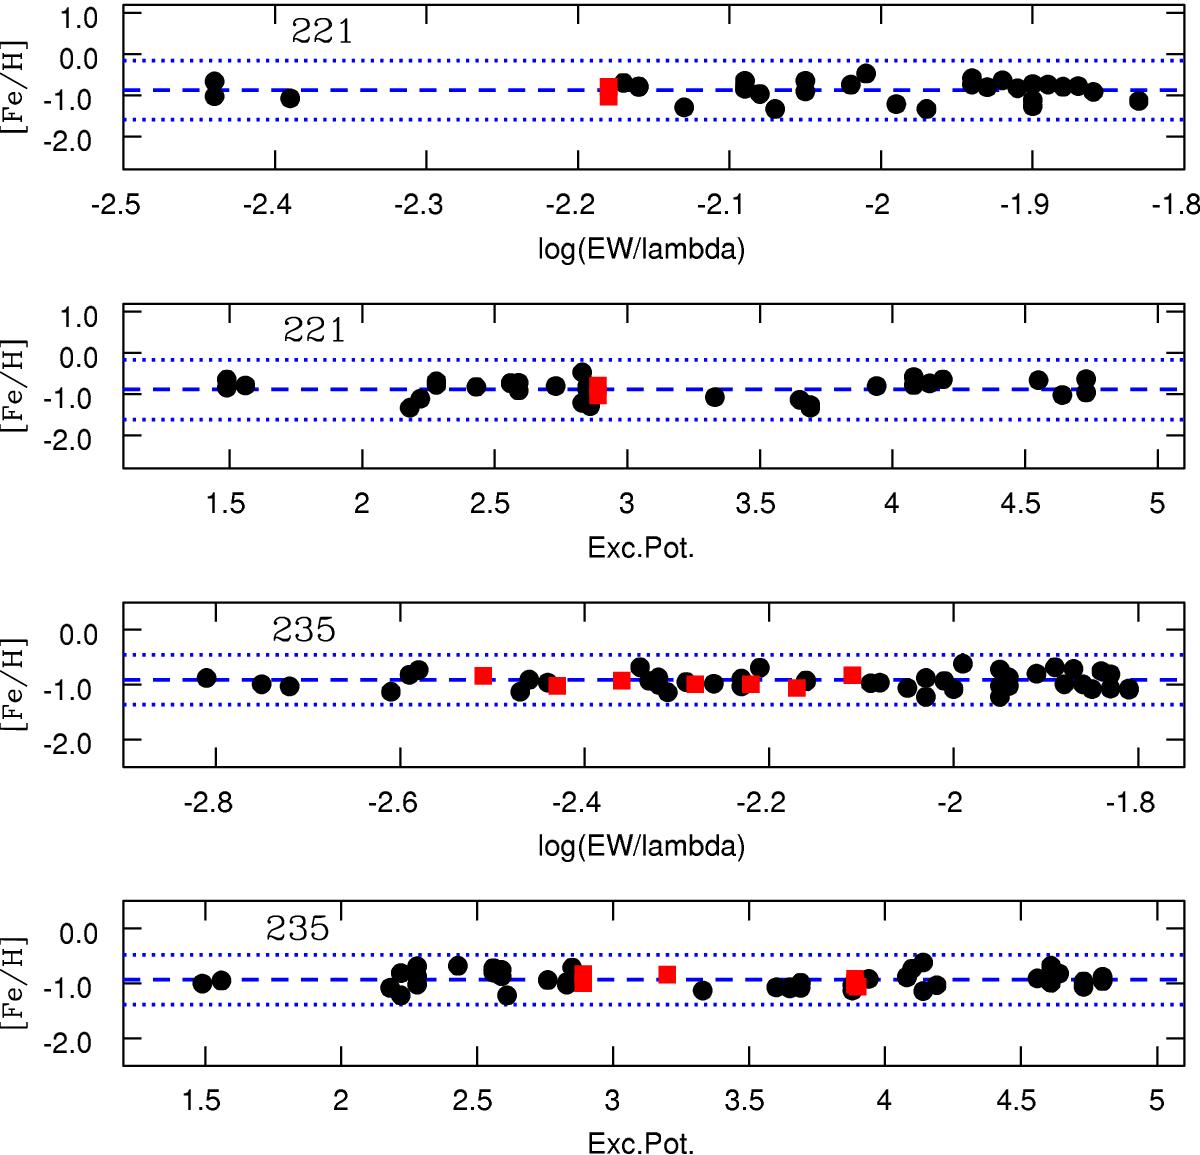
Ionization and excitation equilibria of Fe lines for stars 221 and 235, using the newly derived atmospheric parameters. The black dots are the abundances obtained from the Fe i lines, the red squares are those from the Fe ii lines, the blue dashed lines represent the linear fit to data, and the dotted blue lines are the same linear fit moved vertically by ± 3σ, where σ is the standard error of the mean.
Current usage metrics show cumulative count of Article Views (full-text article views including HTML views, PDF and ePub downloads, according to the available data) and Abstracts Views on Vision4Press platform.
Data correspond to usage on the plateform after 2015. The current usage metrics is available 48-96 hours after online publication and is updated daily on week days.
Initial download of the metrics may take a while.